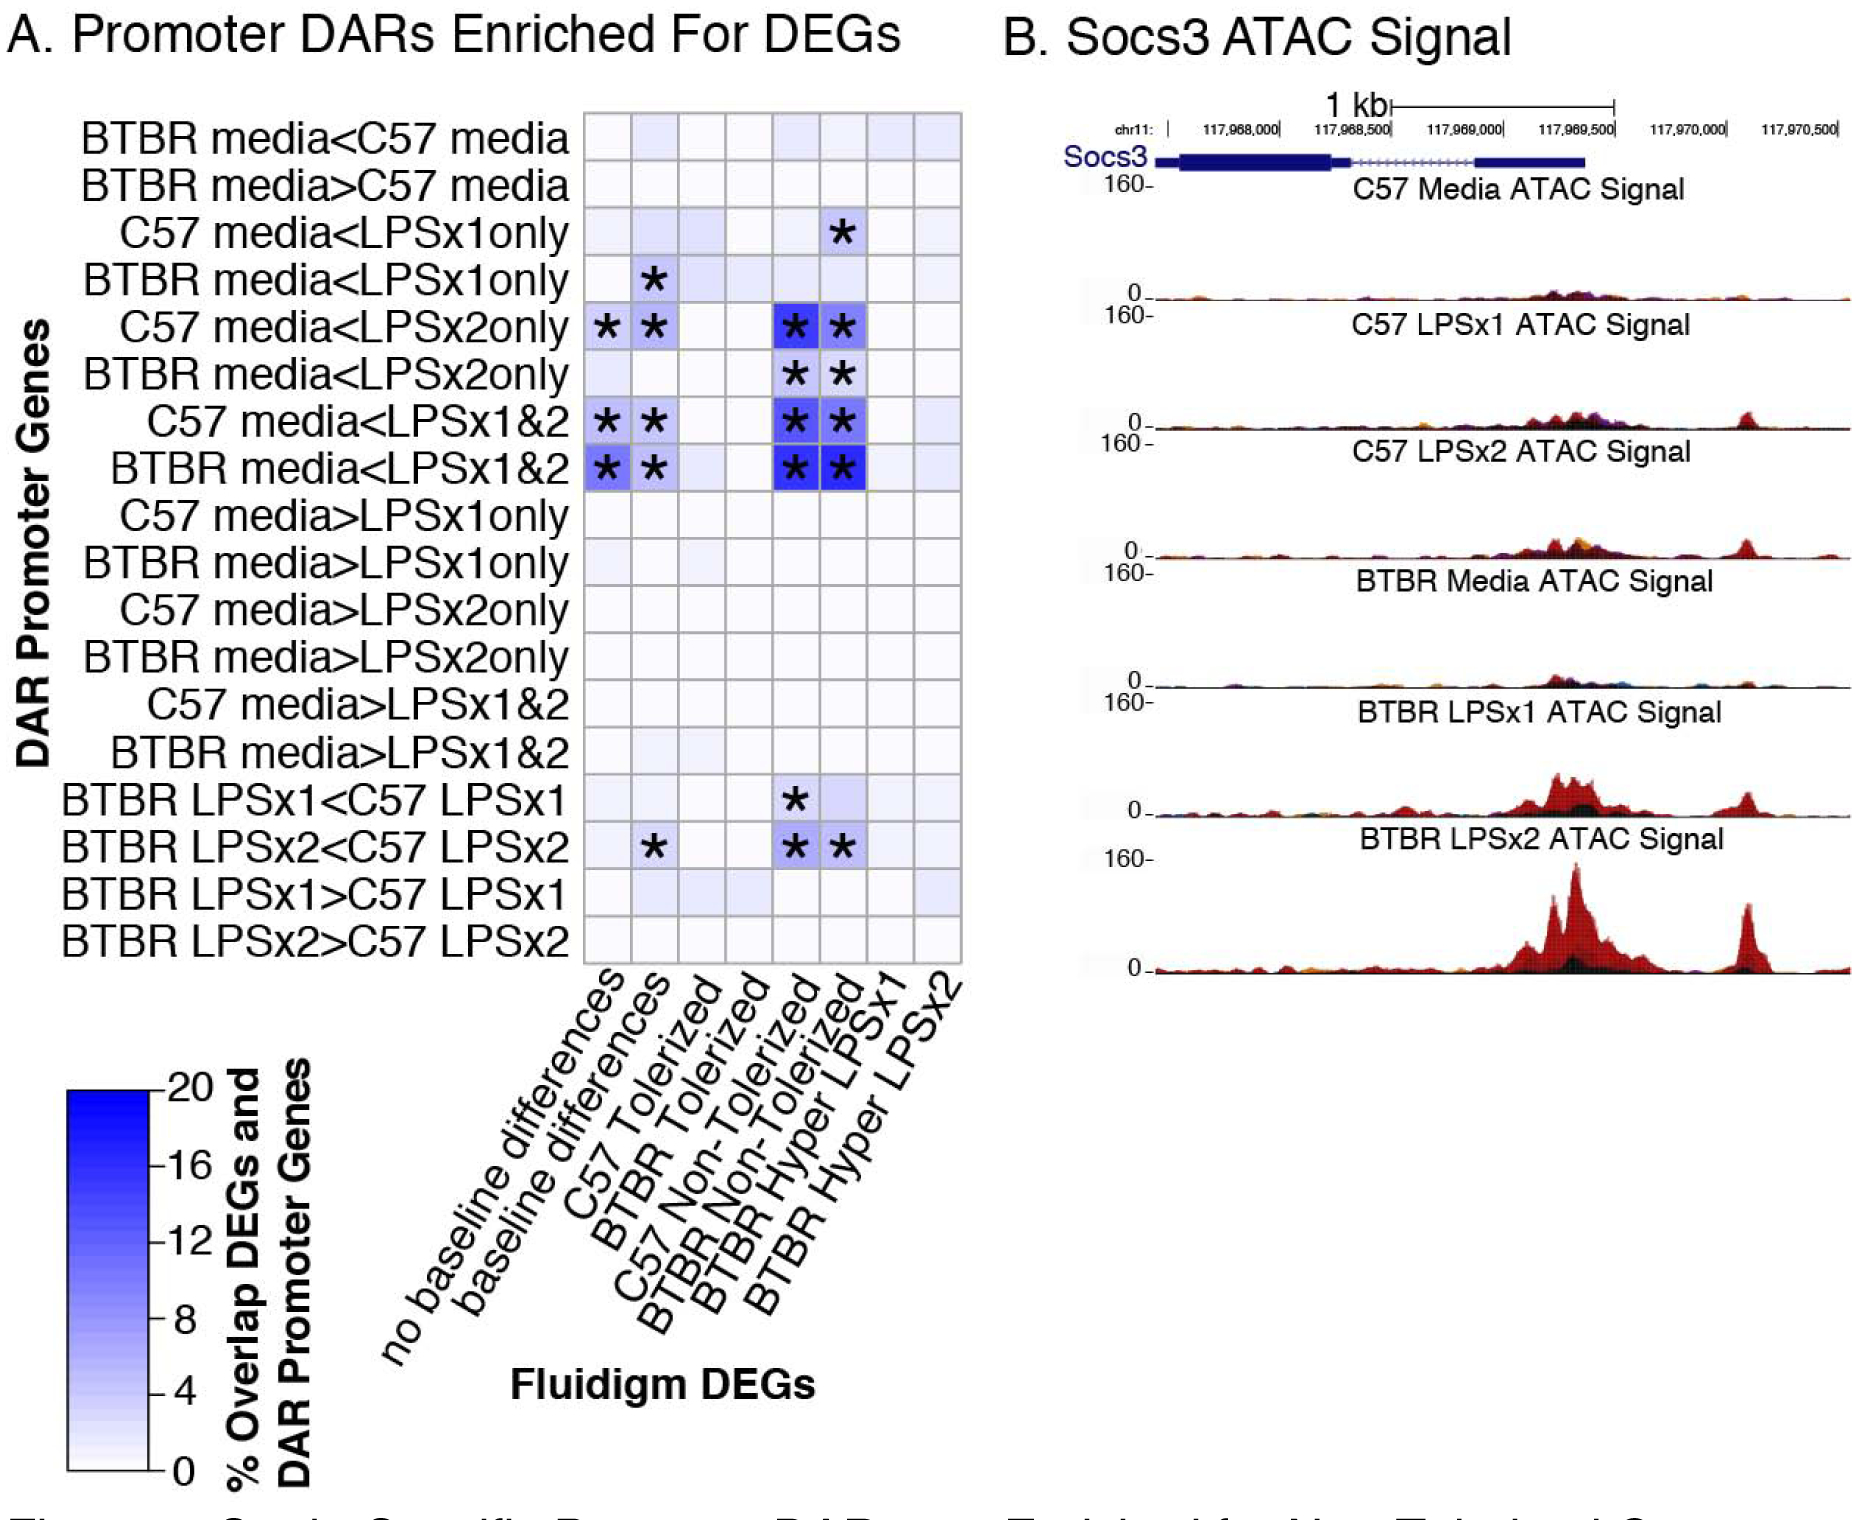
Figure 5.

Strain-Specific Promoter DARs are Enriched for Non-Tolerized Genes A. Differentially expressed genes (DEGs) from Figure 2 were examined for enrichment of DARs within promoter regions of genes. The heatmap is colored by the percent of overlap between each row/column comparison. Significant enrichments (Fisher’s exact test) are denoted with * for all FDR corrected p-value < 0.05. B. Normalized ATAC-seq signal over the promoter region of the Socs3 gene. Socs3 shows a non-tolerized pattern of gene expression (Figure 2B) and shows increased accessibility at its promoter across treatments. Replicates are shown in different colors for each UCSC genome browser track.
