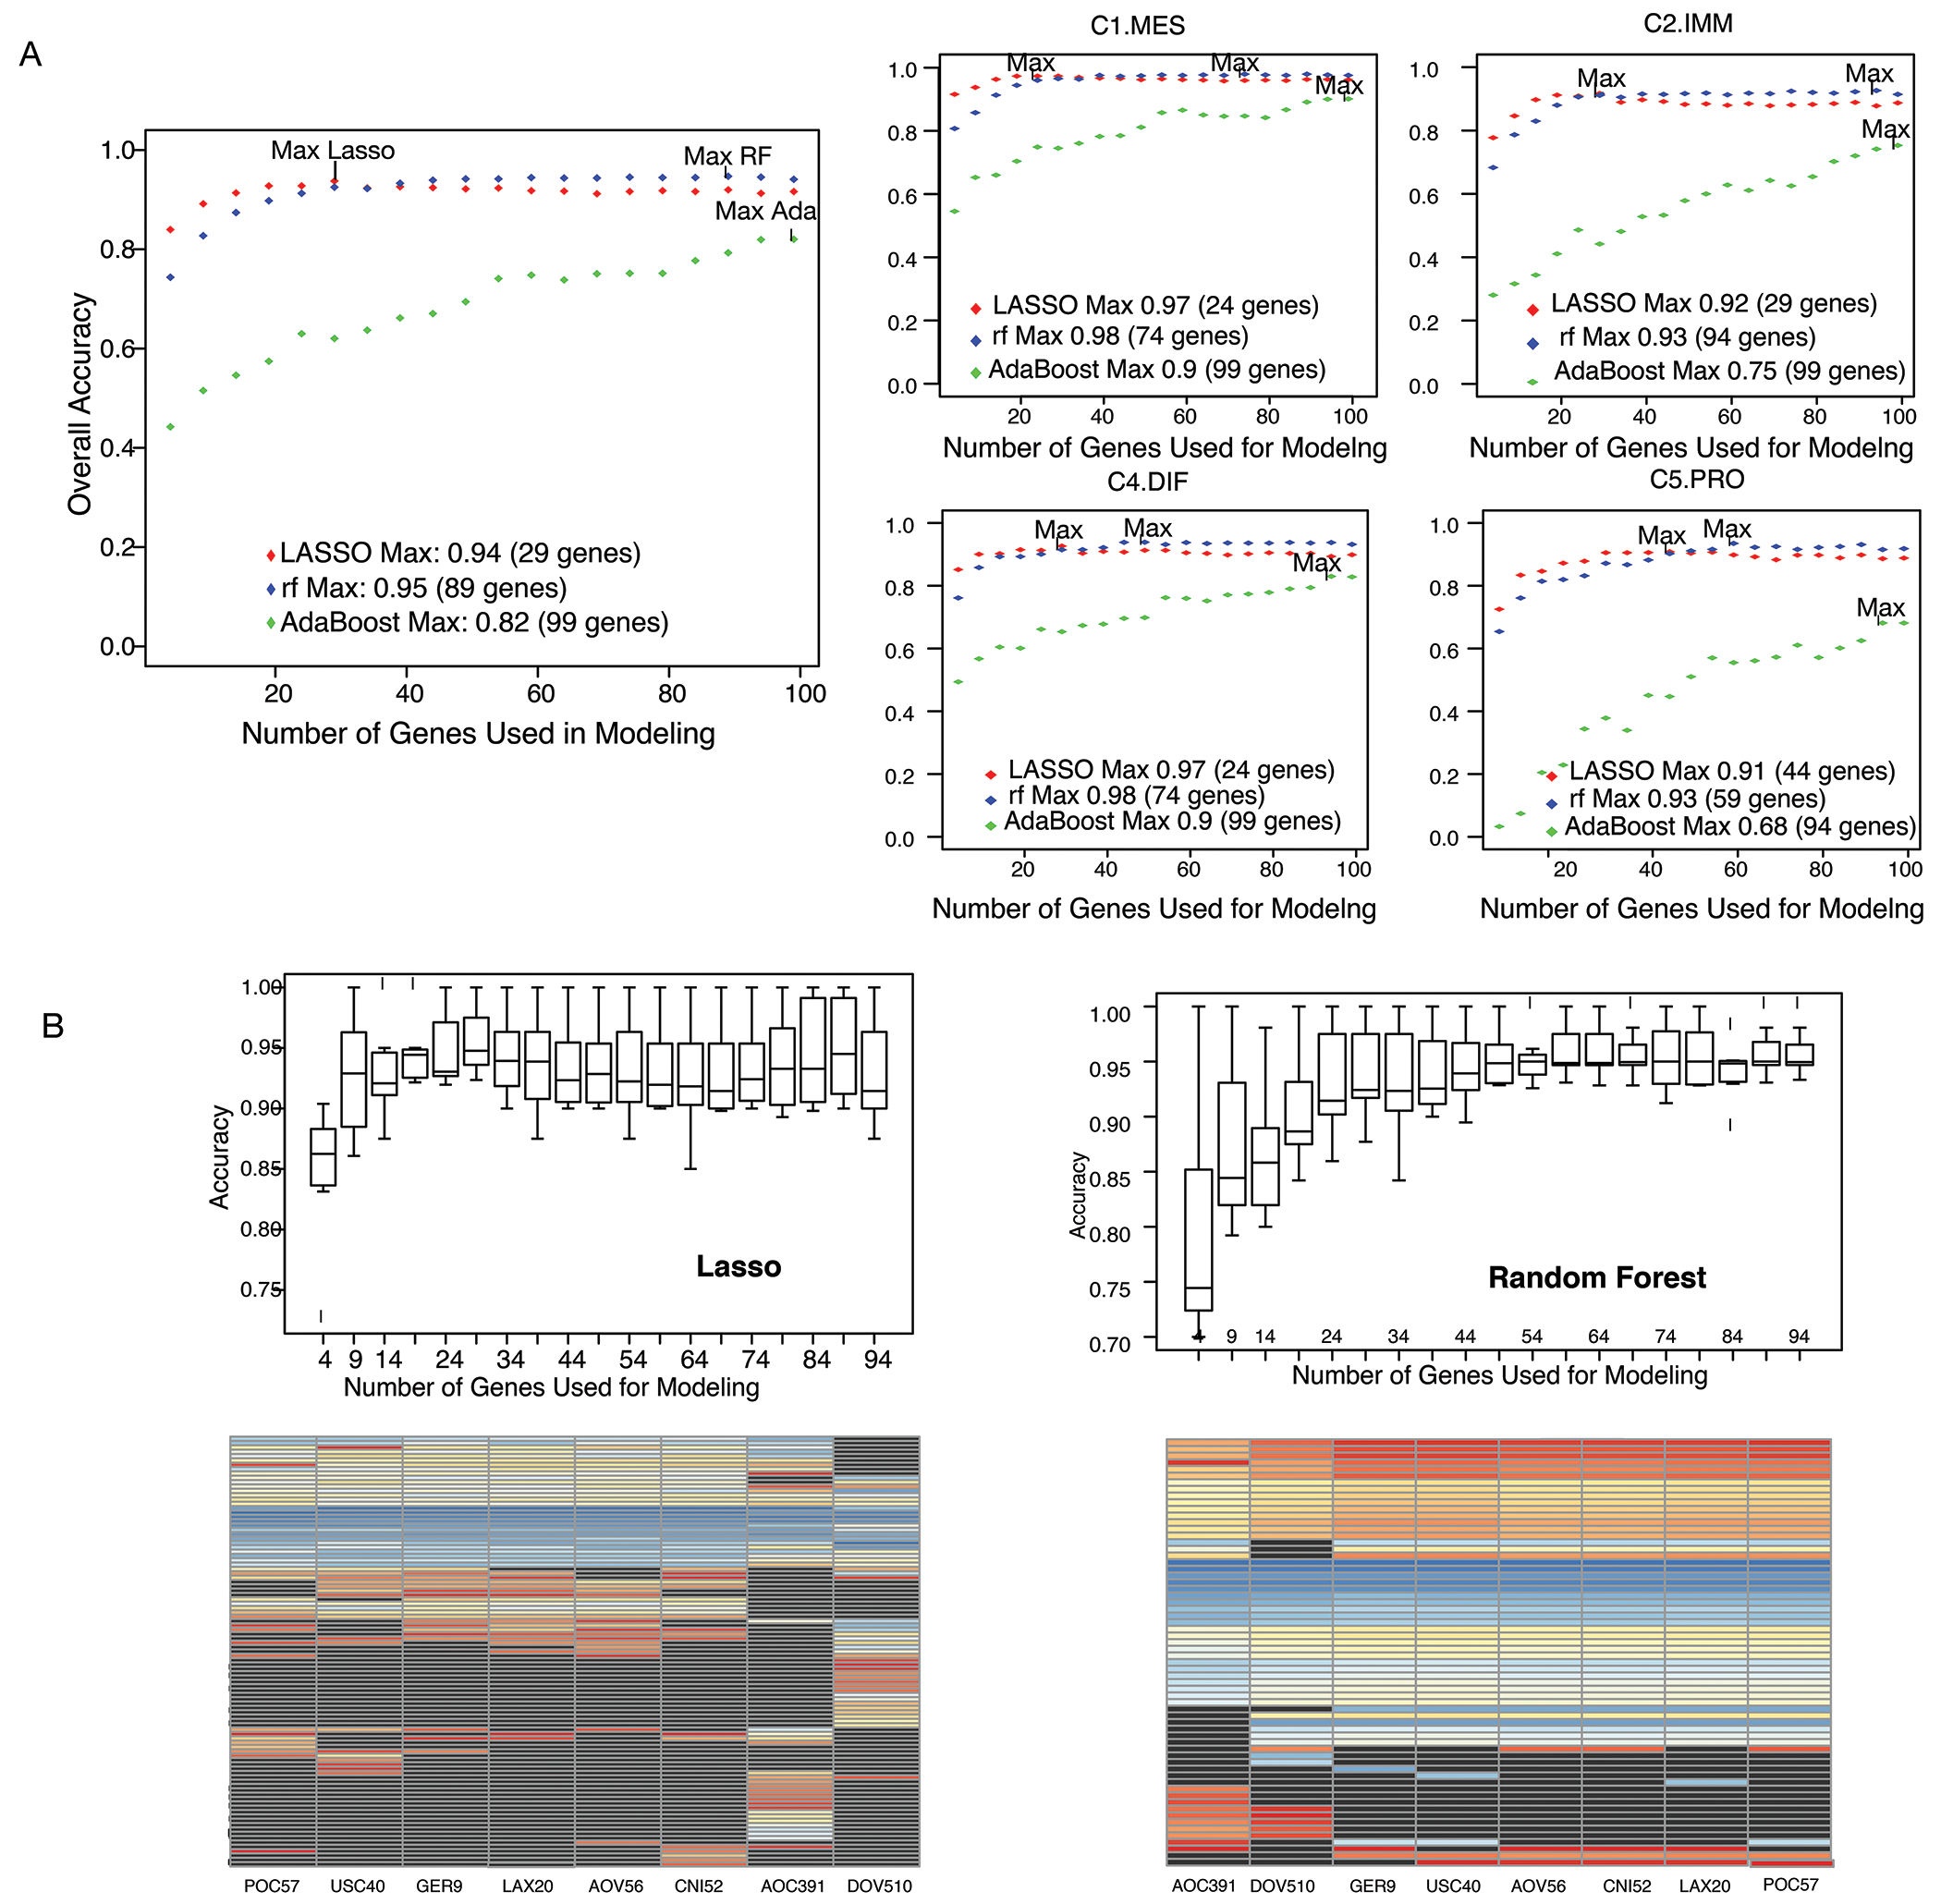
Figure 3:

Model selection metrics for a minimal gene classifier. (A) The aggregate accuracy left and F1-score right (for all samples in all studies) obtained by increasing numbers of genes and using the top n genes from each frequency list computed above, where n varied from 4 to 100 in increments of 5. Note that the top n genes from each study were not necessarily the same. B) Top: Boxplots of the prediction accuracy by study using the LASSO and the random forest algorithm. Each point in the boxplot corresponds to the individual study prediction (when left-out). Bottom: Heatmap depicting the importance rank of the top 50 ranking genes obtained from each data partition in the leave-one-study out scheme.
