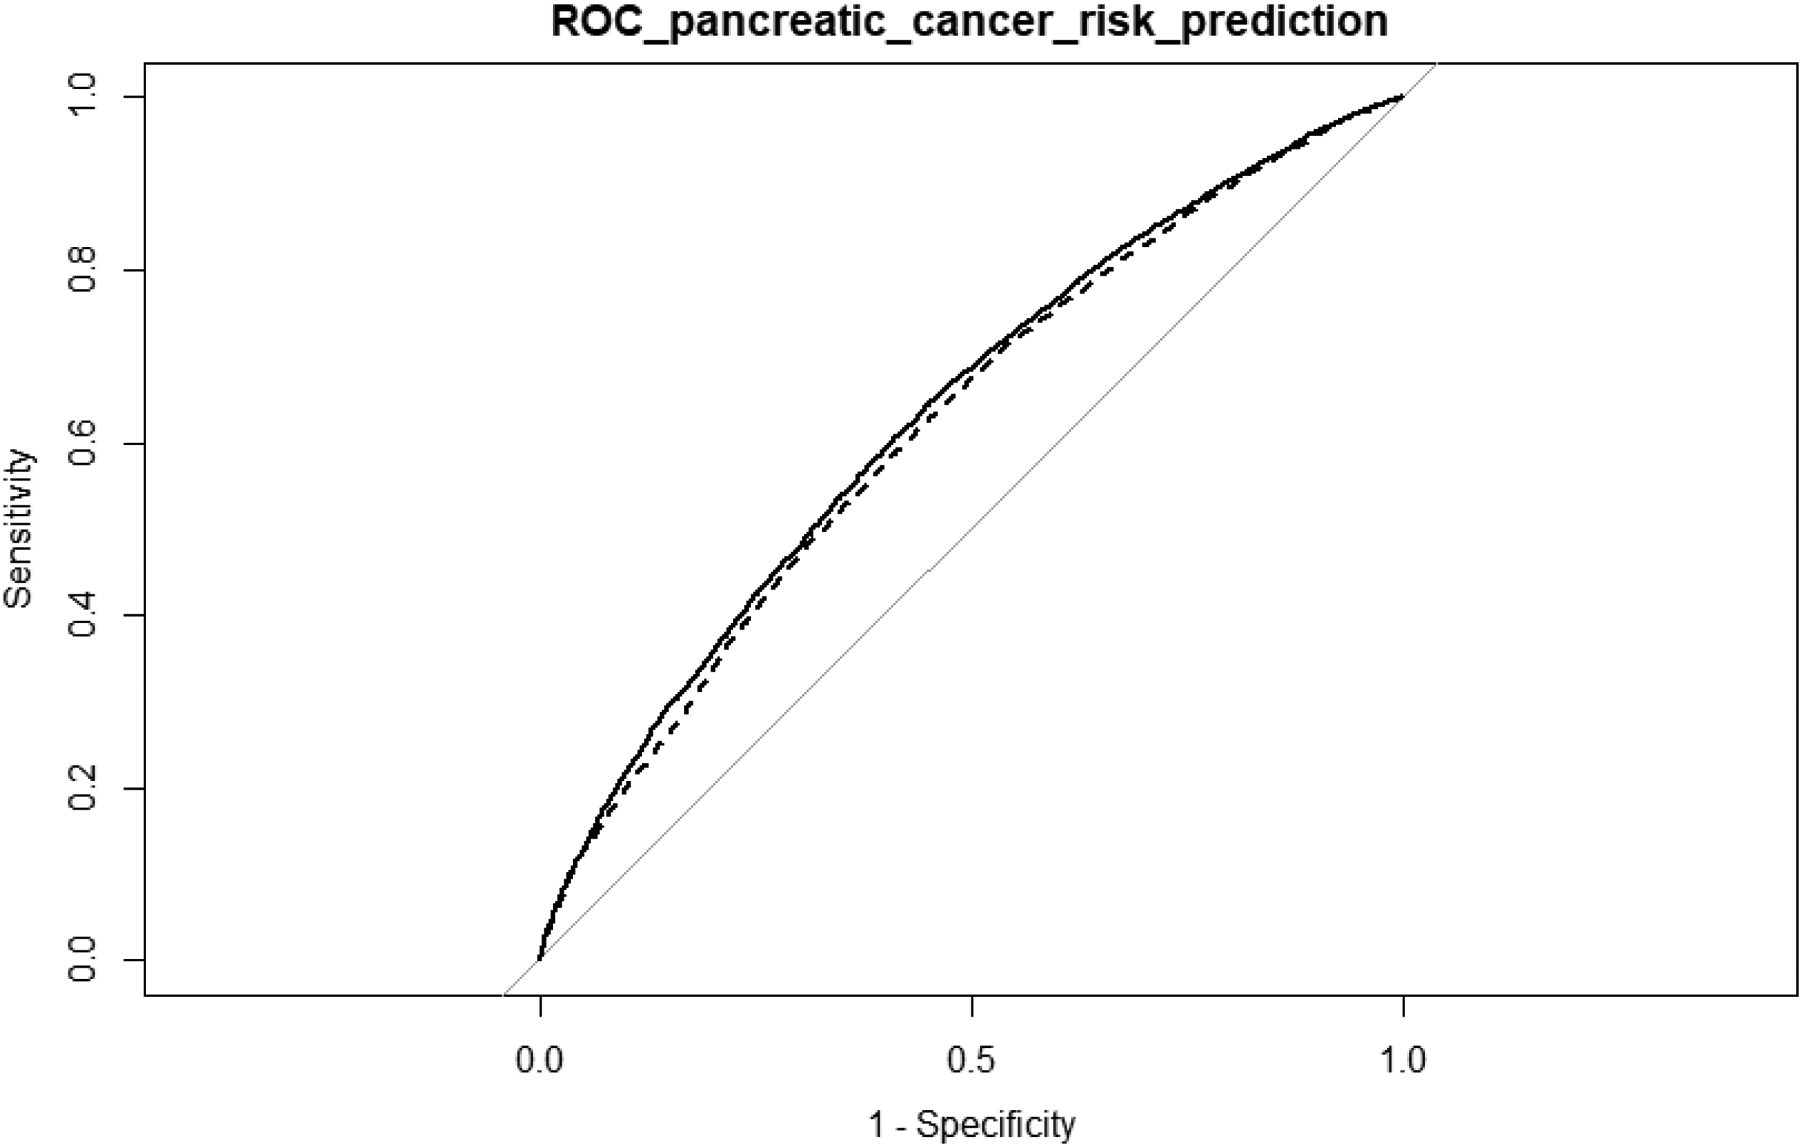
Figure 3.

Performance of prediction models with and without incorporating TWAS identified genes in pancreatic cancer risk prediction. The dash line represents the PRS1 including age, sex, top principal components, and GWAS identified risk variants. The solid line represents PRS2 which also included TWAS identified genes. The AUC for PRS1 and PRS2 are 0.621 and 0.633, respectively.
