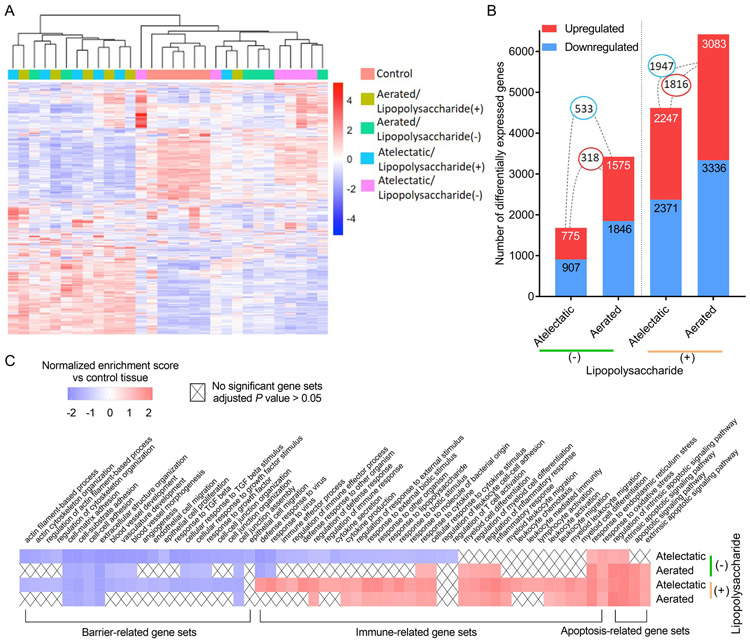
Figure 4. Regional transcriptomics differ according to regional aeration and systemic lipopolysaccharide (LPS) exposure.
(A) Hierarchical clustering shows distinct gene expression profiles according to lung aeration and LPS exposure. Gene expression values (log2-transformed intensities) are scaled and depicted in color code format: Red: upregulated; Blue: downregulated. (B) Number of differentially expressed genes (absolute fold change>1.5 and Padj<0.05) in atelectatic and aerated tissues in LPS(−) or LPS(+) conditions vs control. Red: upregulated; Blue: downregulated. Connections between bars show the number of common genes between lung regions. (C) Gene sets differentially enriched in combination of aeration state and LPS exposure vs control. Cells are colored according to normalized enrichment scores, and "X" denotes no significance (Padj>0.05).

