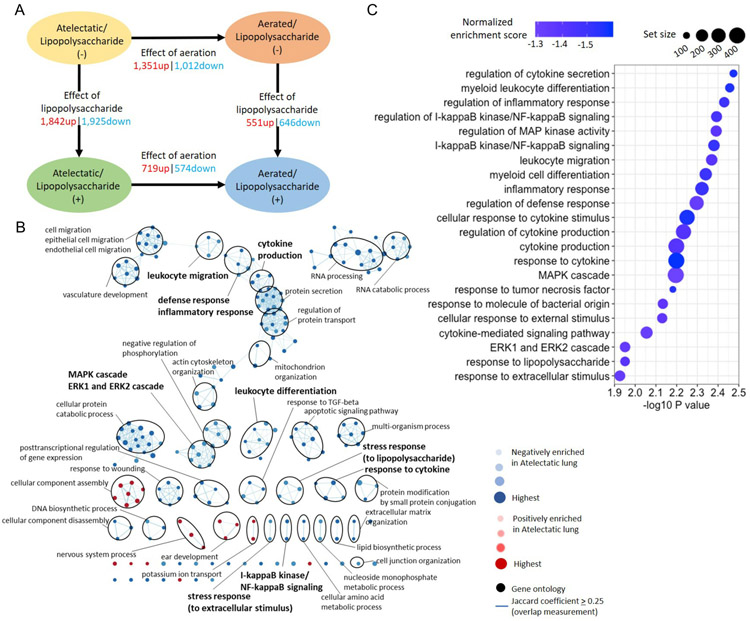
Figure 5. Dysregulated transcriptomic responses of local immunity in atelectasis without systemic lipopolysaccharide (LPS) exposure.
(A) Number of differentially expressed genes (absolute fold change>1.5 and Padj<0.05) in atelectatic and aerated lung in LPS(−) or LPS(+) conditions. Up: upregulated; down: downregulated. (B) Network visualization of gene sets in atelectasis vs aerated regions. Node color and darkness indicate the signal and absolute value of normalized enrichment scores in atelectasis: red: positive; blue: negative. Node size represents the false discovery rate adjusted enrichment P-value. Overlap of genes between nodes is indicated by an edge. Immune-related gene sets are highlighted in bold. (C) Gene sets in LPS(−) relevant to immune response negatively enriched in atelectatic vs aerated lung. Node colors represent normalized enrichment score and node sizes represent the number of genes in the set.

