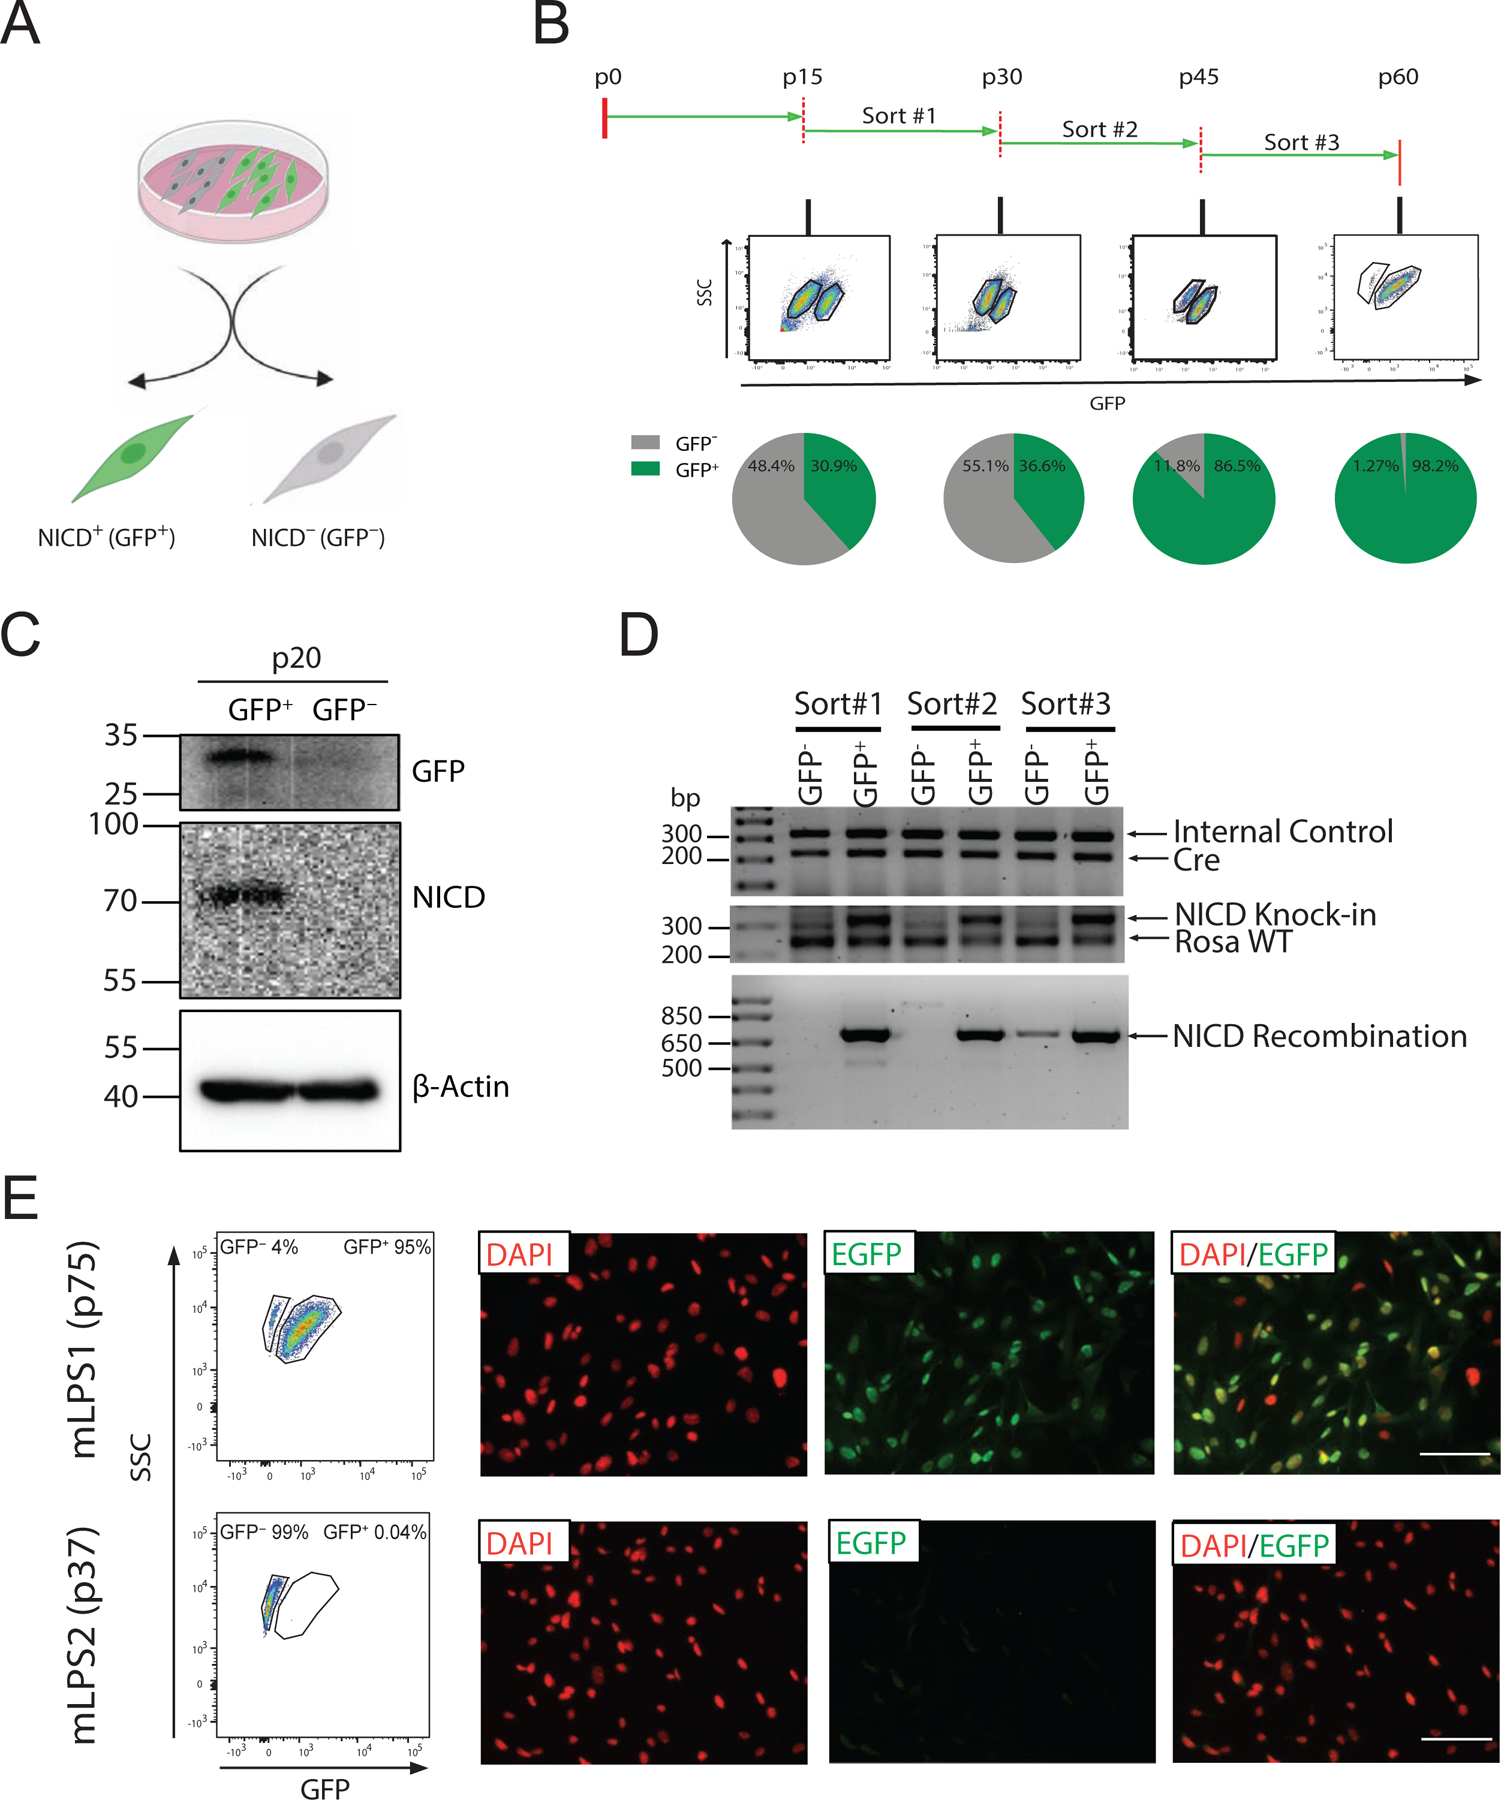
Figure 2. Enrichment of GFP+ LPS cells from primary mLPS cells.

(A) Schematic representation of the subpopulations of mLPS mixed cells; GFP+ (NICD overexpressing, NICDOE) and GFP− (NICD non-overexpressing, NICDWT) cells. (B) Fluorescence activated cell sorting of GFP+ cells at p15, p30 and p45, sequentially. (C) Western blot analysis of GFP+ and GFP− mLPS cells showing NICD and GFP protein levels. (D) Genomic DNA analysis of different batch of sorted GFP+, GFP− cells at various passages. Cre represents Adipoq-Cre, Rosa WT represents wild type Rosa locus, NICD Recombination represent Adipoq-Cre mediated recombination at the NICD knock-in region. (E) Flow cytometry analysis of mLPS1 cells and mLPS2 cells at late passage by GFP fluorescence, and immune fluorescence staining of GFP protein (green) and nuclei by DAPI (red). Scale bars, 100 μm.
