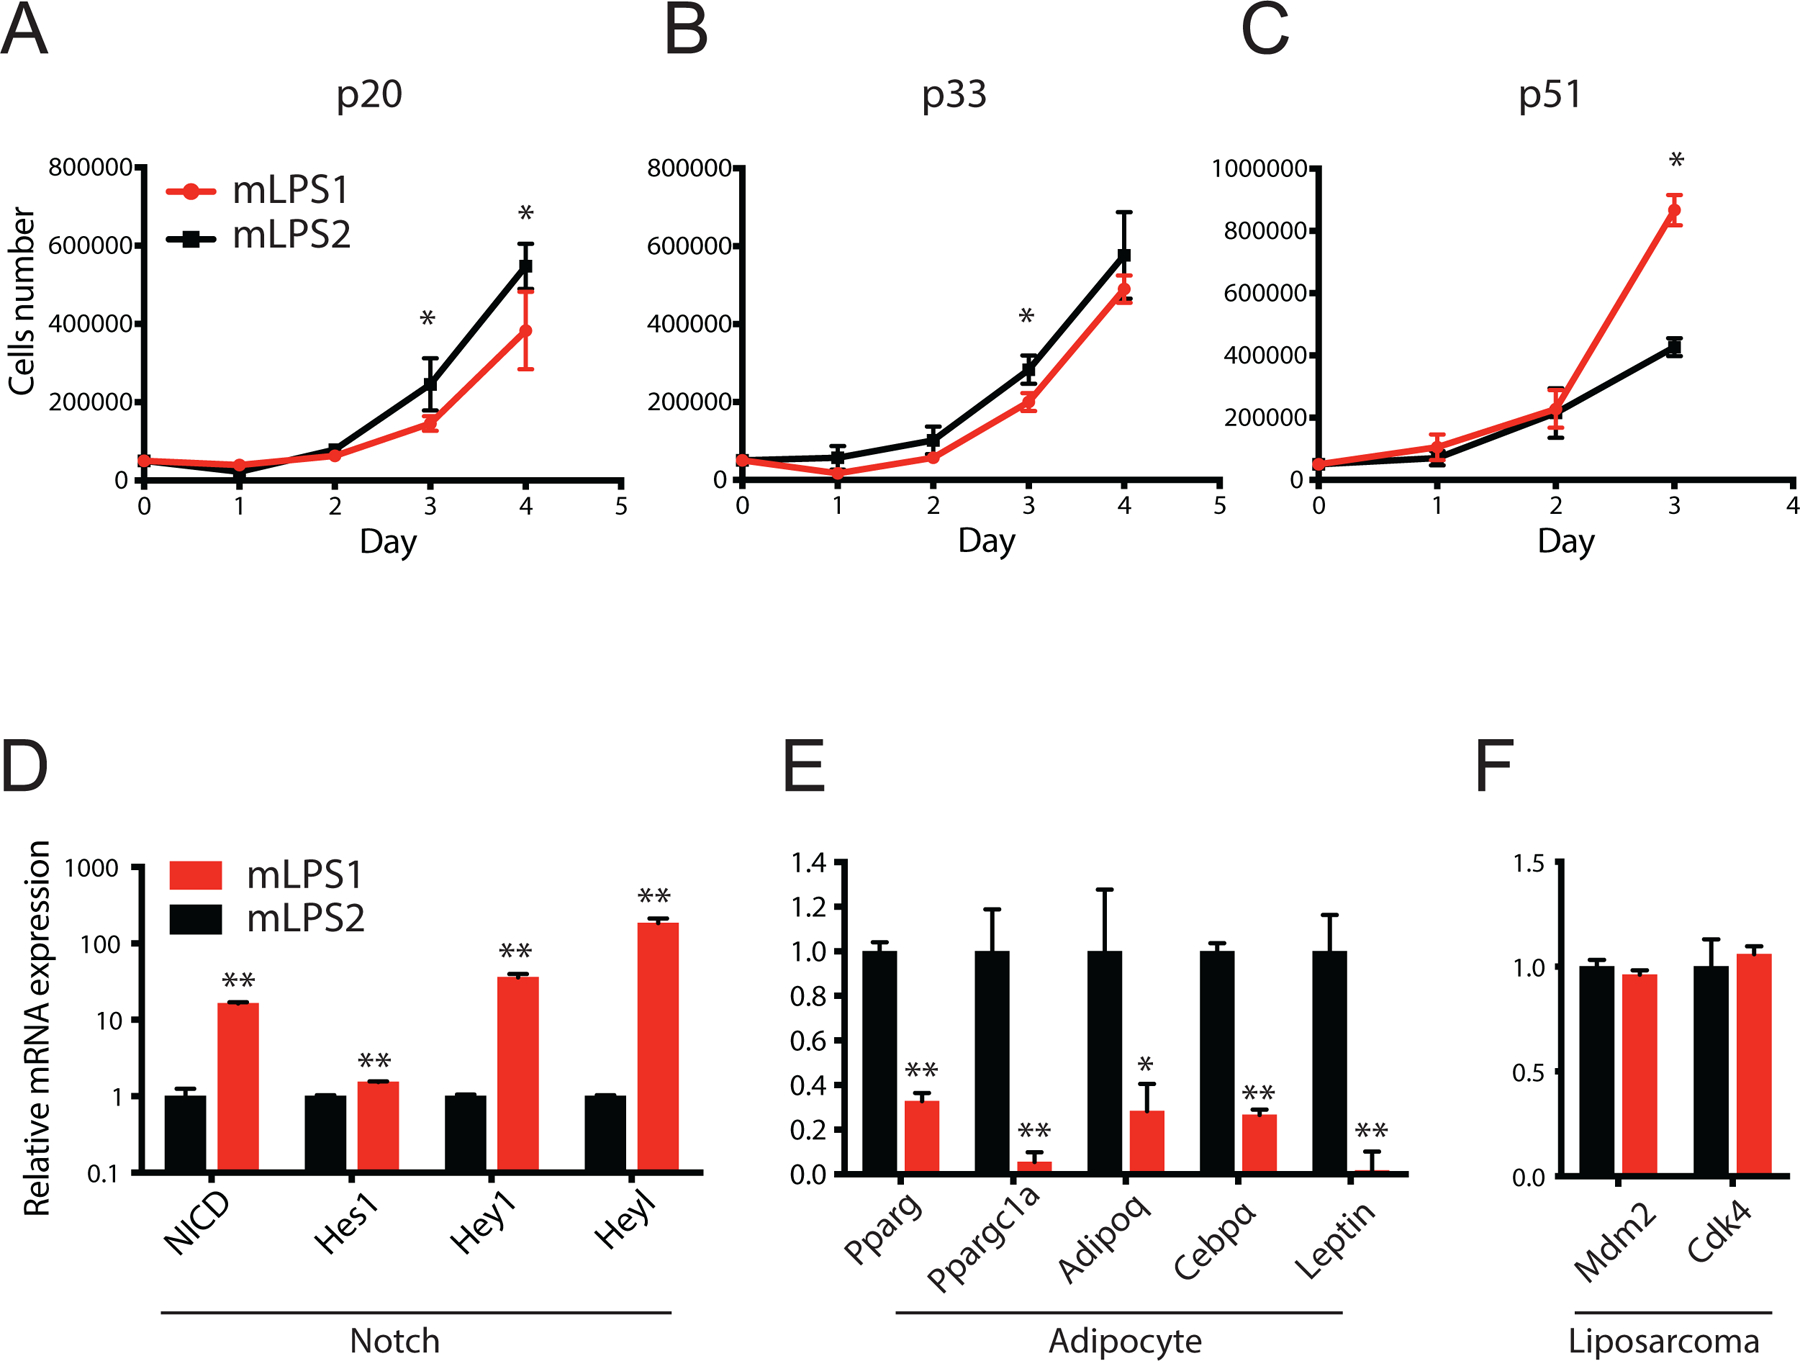
Figure 3. Growth and gene expression of mLPS1 and mLPS2 cells.

(A, B, C) Growth curves of mLPS1 and mLPS2 cells at p20, p33 and p51, respectively. Cells were seeded in 24-well plates at 5 x 10⁴ cells per well and cultured for 4 days. Numbers of live cells were determined by cell counting with trypan blue staining. (D) Relative mRNA levels of NICD and Notch target genes (Hes1, Hey1, and Heyl) in mLPS1 and mLPS2 cells. (E) Relative mRNA levels of mature adipocyte markers (Pparg, Ppargc1a, Adipoq, Cebpα, Leptin) in mLPS1 and mLPS2 cells. (F) Relative mRNA levels of LPS markers (Mdm2, CDK4) in mLPS1 and mLPS2 cells. Data are presented as mean ± SEM, N=3. *p< 0.05, **p< 0.001.
