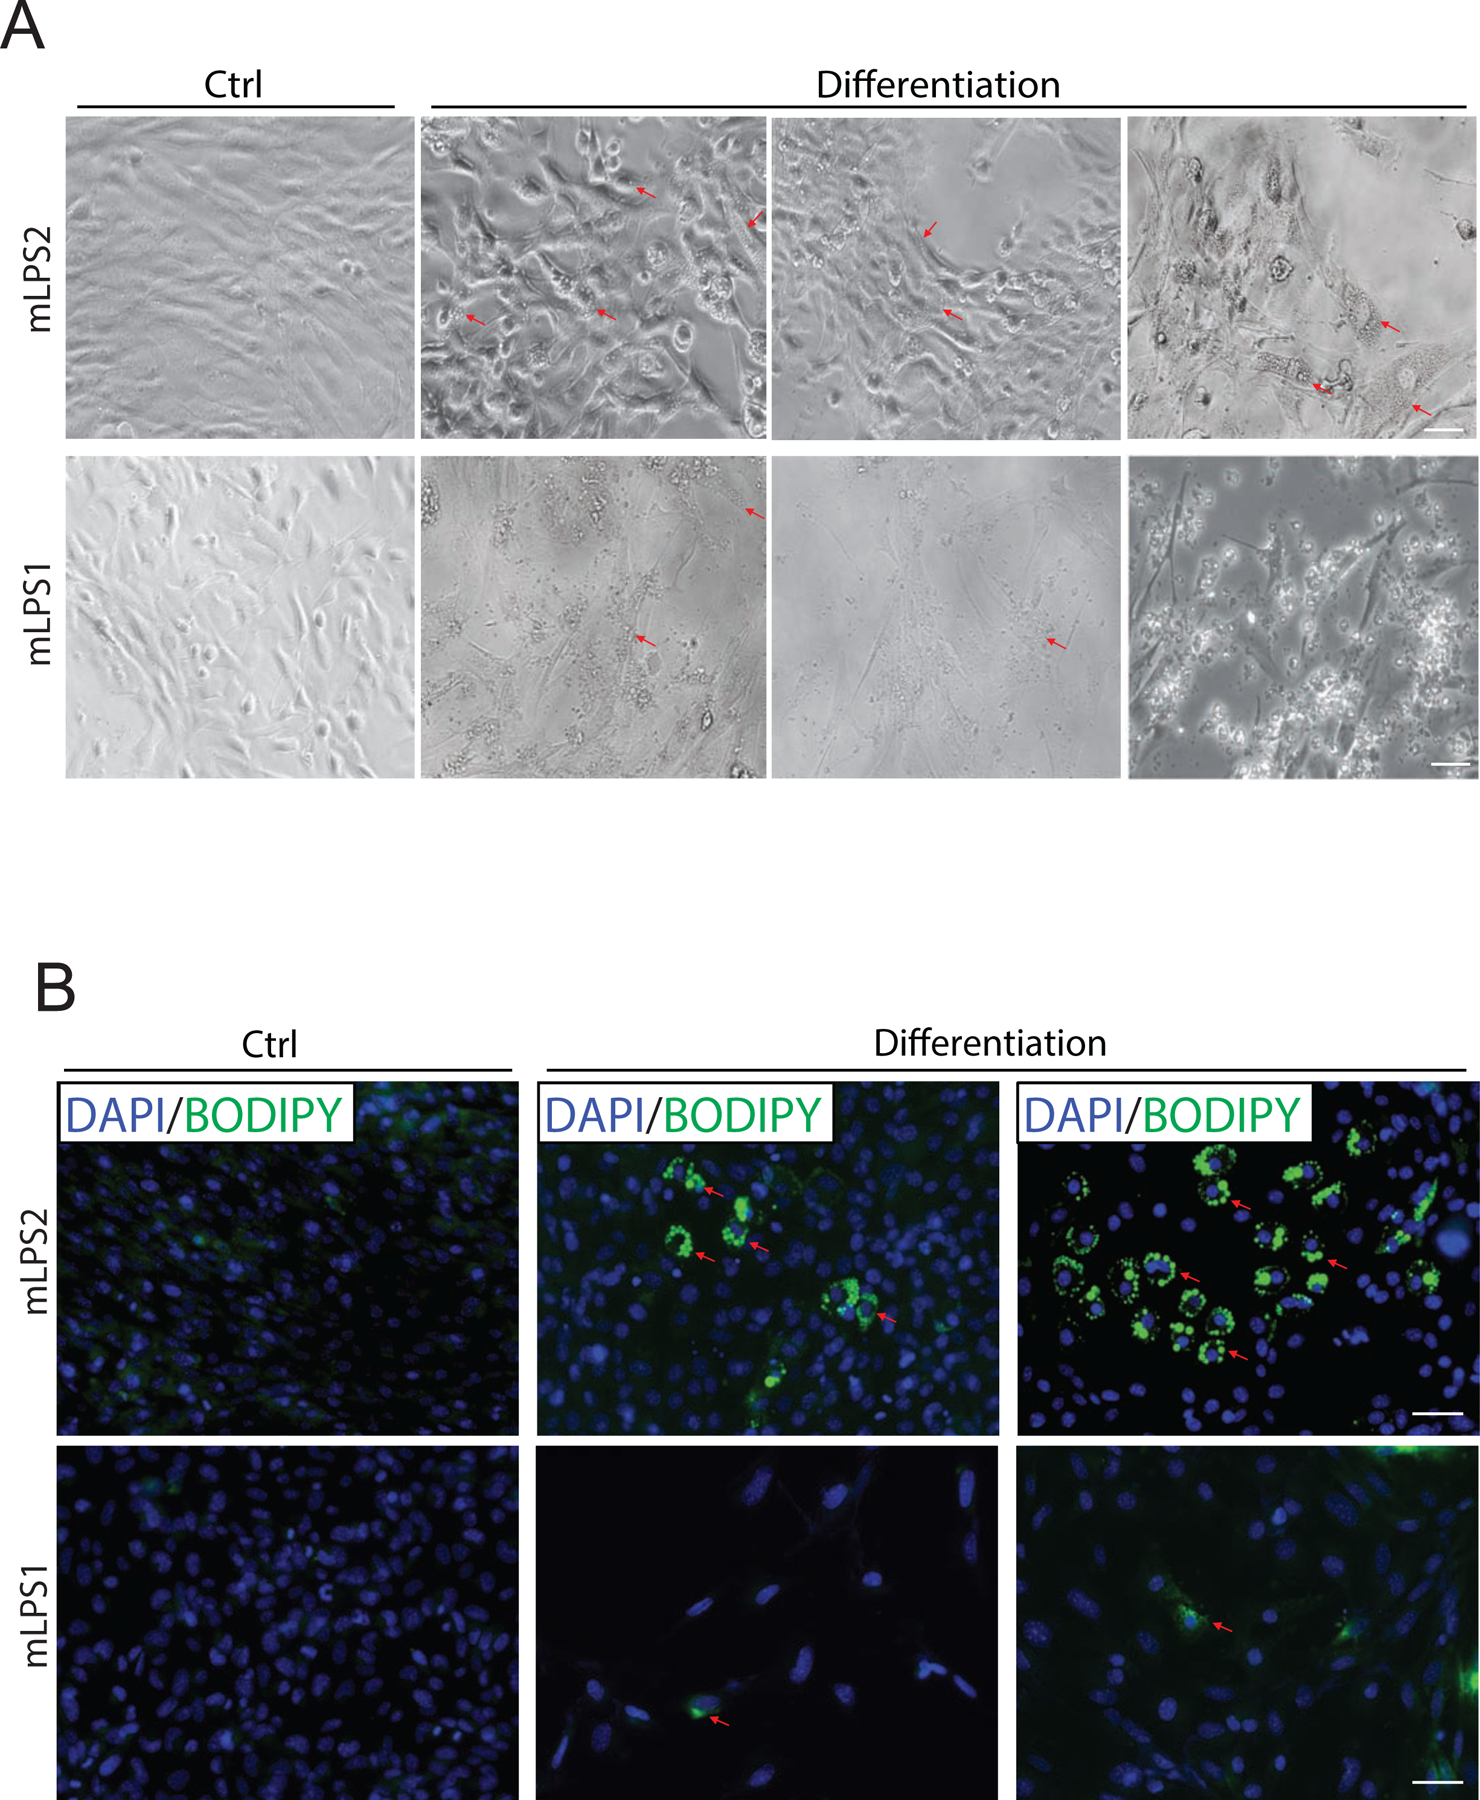
Figure 4. Differentiation of mLPS1 and mLPS2 cells in culture.

(A) Phase contrast images of mLPS1 cells and mLPS2 cells after treated with induction medium to induce adipogenesis for 8 days. The arrowheads indicate lipid droplets. (B) Fluorescent staining images of lipid droplets (labeled with BODIPY in green) after differentiation, visualized by immunofluorescence microscopy. Nuclei were counterstained with DAPI (blue). Scale bars, 100 μm. N=3.
