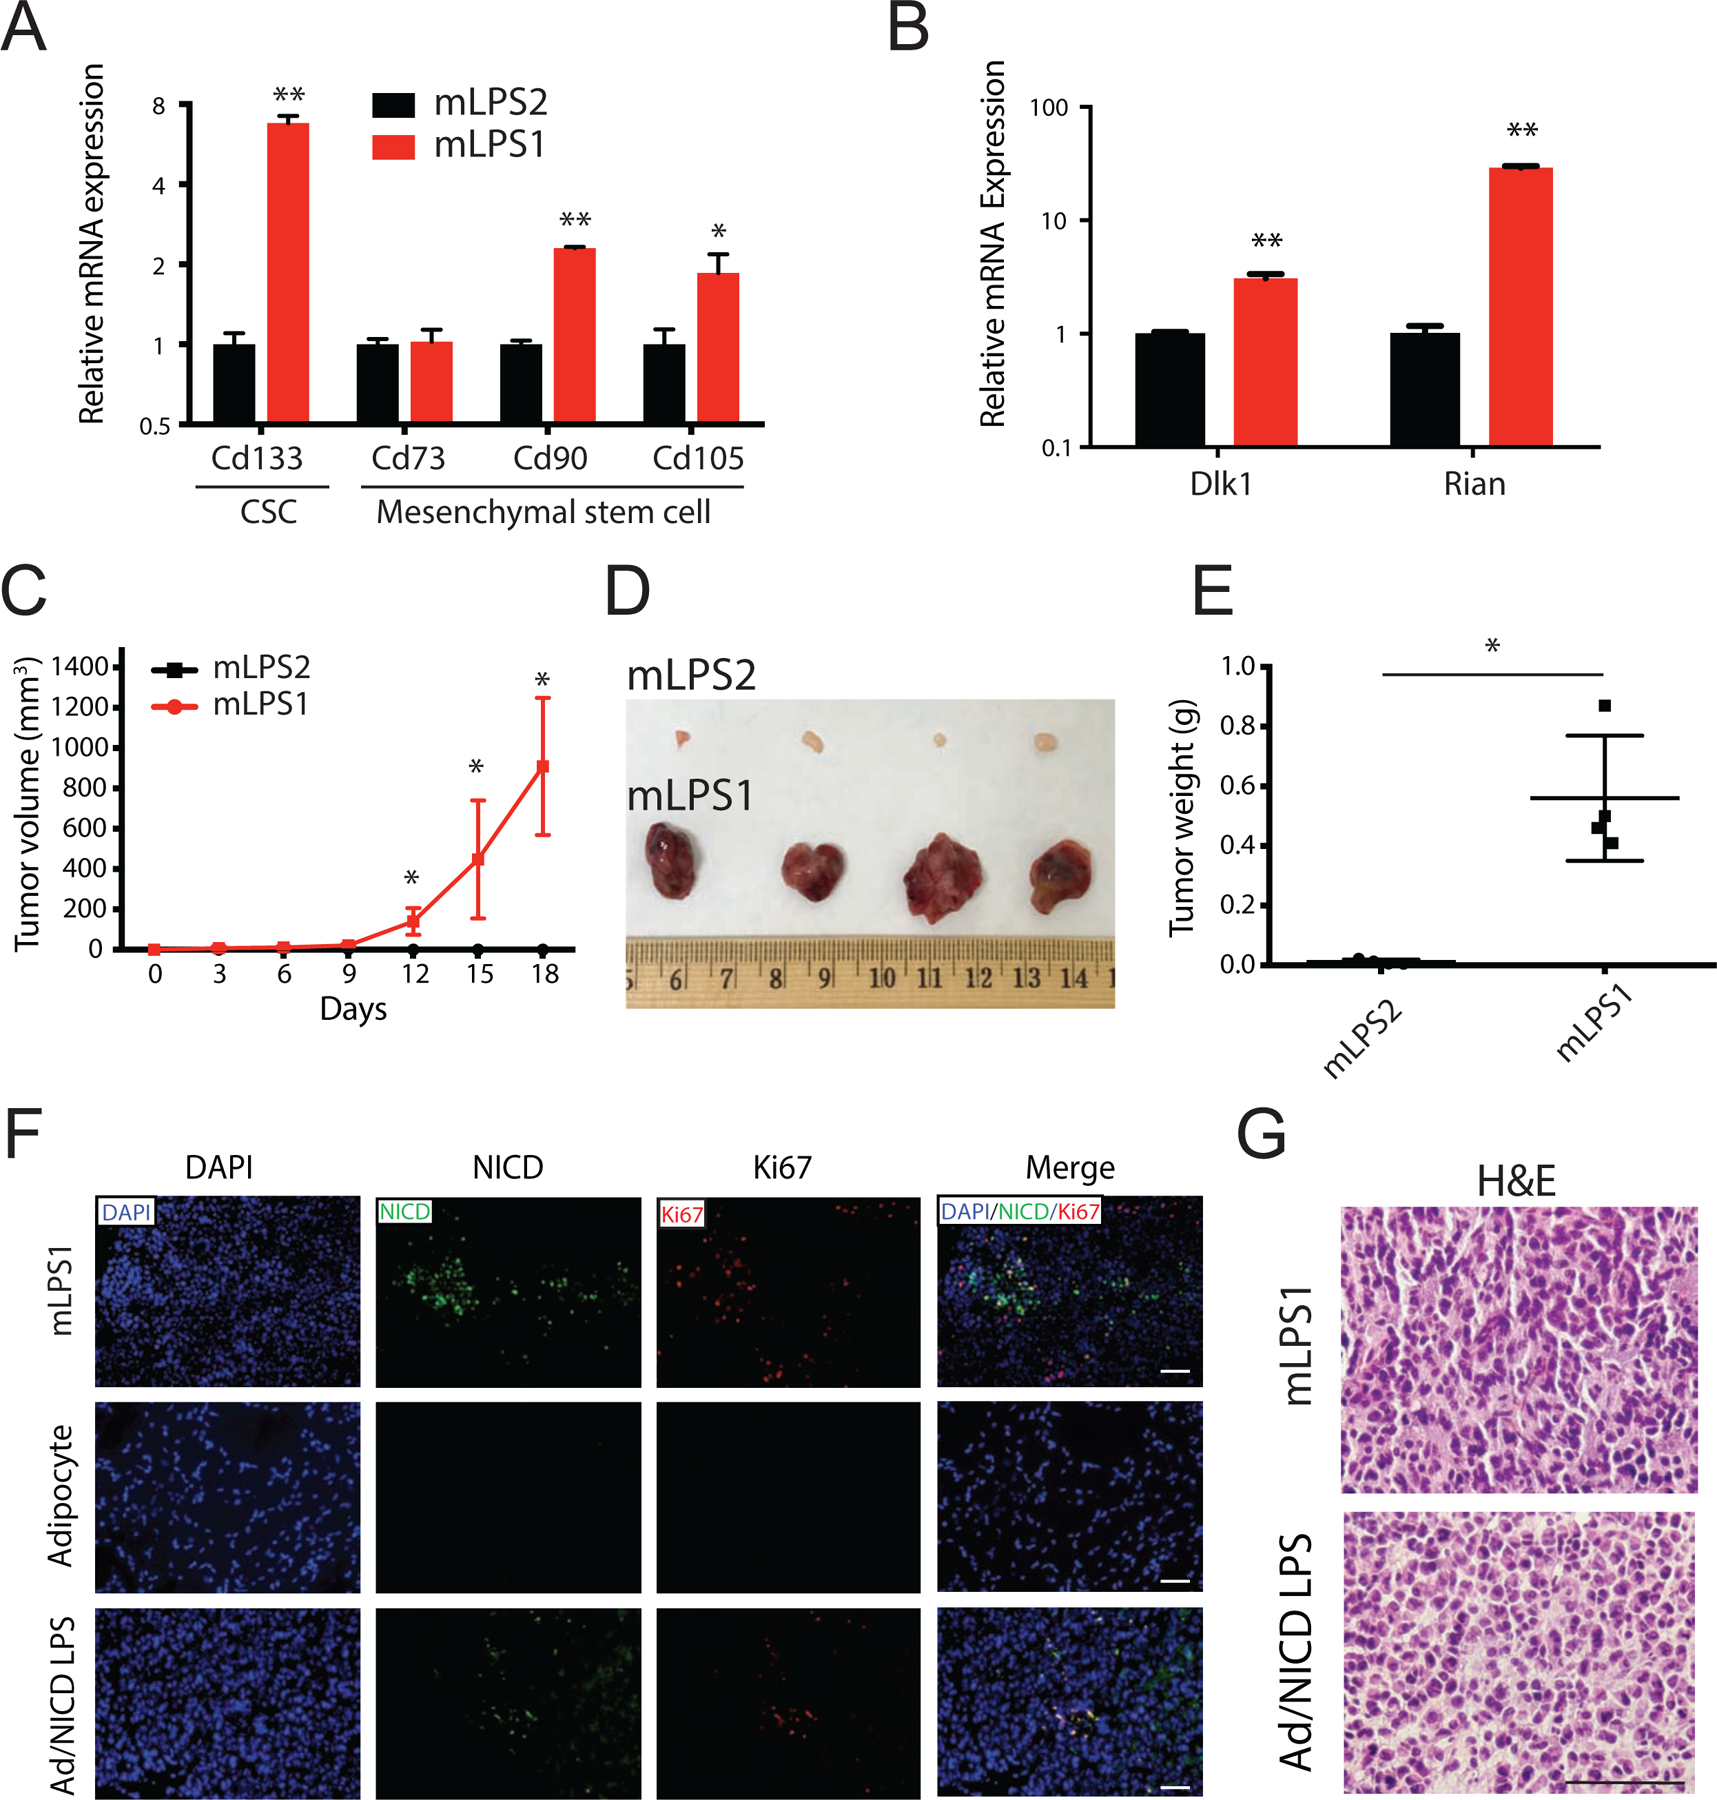
Figure 5. Notch-activated mLPS1 cells contributes to tumorigenesis in vivo.

(A) Relative mRNA levels of cancer stem cell marker CD133 and several mesenchymal stem cell markers (CD73, CD90, and CD105) in mLPS1 and mLPS2 cells. (B) Relative mRNA levels of Dlk1 and long non-coding RNA Rian in the Dlk1–Dio3 imprinted region in mLPS1 and mLPS2 cells. Data are presented as mean ± SEM, N = 3. *p< 0.05, **p< 0.001. (C) Tumorigenicity of mLPS1 and mLPS2 cells examined by injecting 2 x 10⁶ mLPS1 cells subcutaneously to the left flank and 2 x 10⁶ mLPS2 cell to the right flank of NRG mice (N=4). The tumor volume was calculated based on caliper measurement of tumor width and length. (D) Images of the grafted tumors after surgical removal from the NRG recipient mice. (E) Average weights of the tumors shown in B. (F) Immunofluorescence staining showing relative expression of NICD (Green) and Ki67 (Red, proliferation marker) in mLPS1-derived allograft tumor, mouse inguinal adipose tissue and primary LPS tissue from Adipoq-Cre/RosaNICD mice. Nuclei were stained by DAPI. (G) H&E staining of tumor sections showing comparable pathology of mLPS1-derived allograft tumors and Notch-driven primary LPS tumors. Nuclei were stained with hematoxylin (blue), and extracellular matrix and cytoplasm were stained with Eosin (pink). Imaging captured using a Leica DMI 6000b microscope. Scale bars, 100 μm. Data is presented as mean ± SEM, N=4. *p< 0.05.
