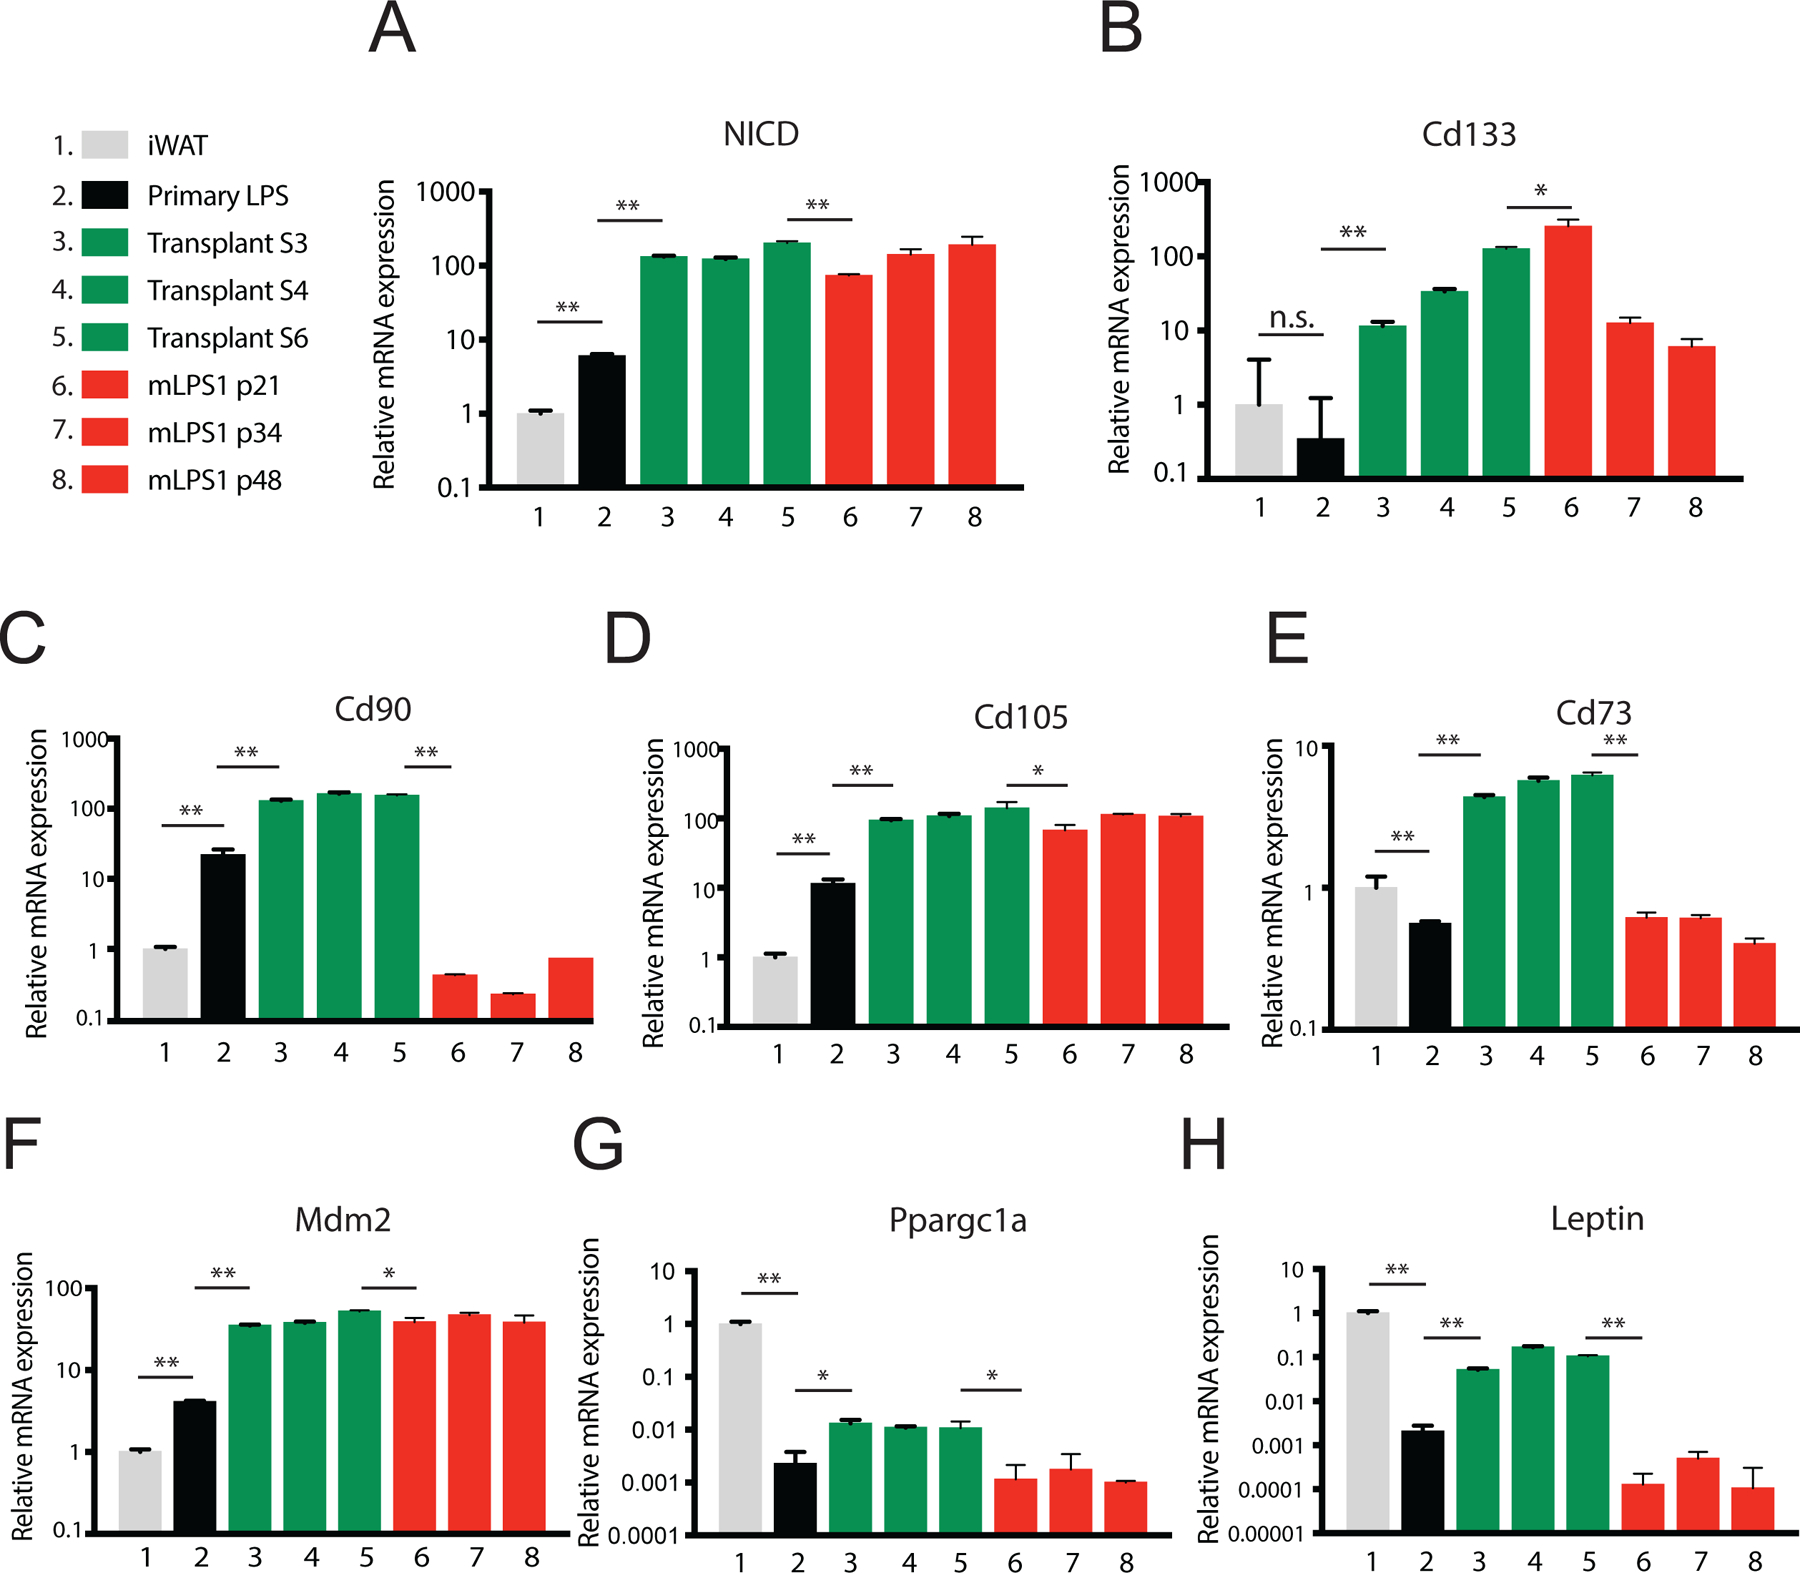
Figure 6. Expression of LPS, cancer stem cell, and adipogenic markers at various stages during derivation of mLPS1 cells.

Relative mRNA levels of NICD (A); cancer stem cell marker CD133 (B); mesenchymal stem cell markers CD73, CD90, and CD105 (C-E); LPS marker Mdm2 (F); and adipogenic markers Ppargc1a and Letpin (G-H) at various stages were determined by qPCR. iWAT, inguinal white adipose tissue; S1-S3: serially transplanted LPS; p: cell passage numbers of mLPS1 cells. Data are presented as mean ± SEM, N=3. *p< 0.05, **p< 0.001.
