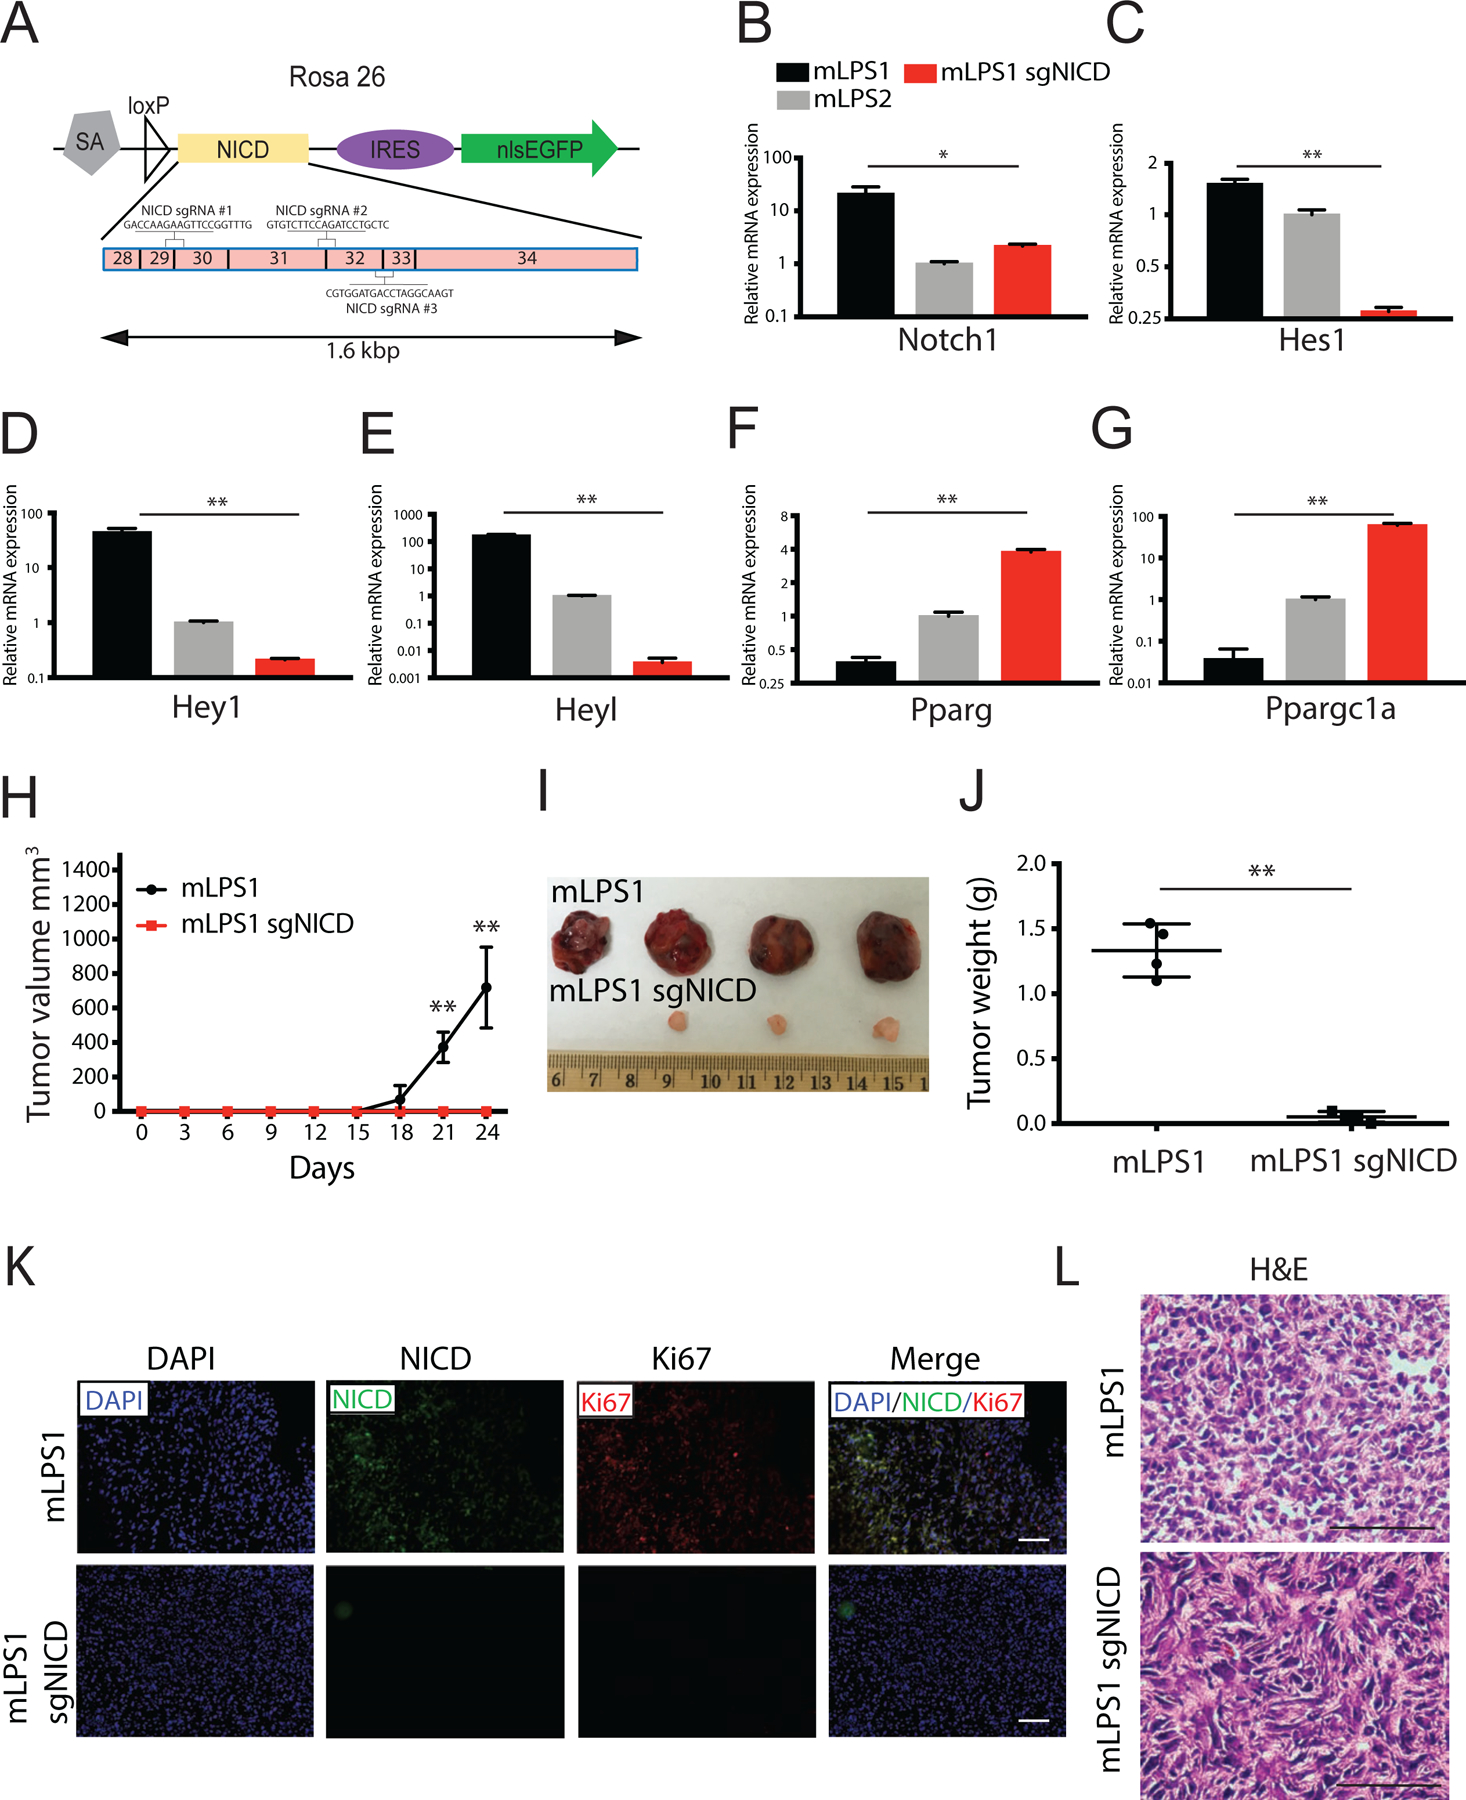
Figure 7. NICD is responsible for the tumorigenic potential of mLPS1 cells.

(A) Genomic structure of RosaNICD cassette. The NICD sequences from exon 28 to 34 were targeted by three single strand guide RNAs: sgRNAs #1, #2, and #3. All three gRNAs span two exons and were co-transfected into cells. (B, C, D, E) Relative mRNA levels of Notch signaling targeted genes (Notch1, Hes1, Hey1, Heyl) in mLPS1, mLPS2, and mLPS1-sgRNA cells (mLPS1 transfected with 2 ug guide RNA and CAS9). (F, G) Relative mRNA levels of mature adipocyte markers in mLPS1, mLPS2, and mLPS1-sgRNA cells. (H) Tumorigenicity of mLPS1 and mLPS1-sgRNA cells determined by injecting 2 x 10⁶ mLPS1 cells subcutaneously to the left flanks and 2 x 10⁶ mLPS1-sgRNA cells to right flanks of NRG mice (n=4). The tumor volume was calculated based on width and length measured with a caliper. (I) Images of the grafted tumors after surgical removal from the NRG recipient mice. (J) Average weights of the tumors shown in H. (K) Immunofluorescent staining showing relative expression of NICD and Ki67 in mLPS1-derived allograft tumor, and mLPS1-sgRNA tissue. Nuclei were stained by DAPI. (L) H&E staining of tumor sections. Nuclei were stained with hematoxylin (blue), and extracellular matrix and cytoplasm were stained with Eosin (pink). Images were captured under a Leica DMI 6000b microscope. Scale bars, 100 μm. Data is presented as mean ± SEM, N=4, *p< 0.05.
