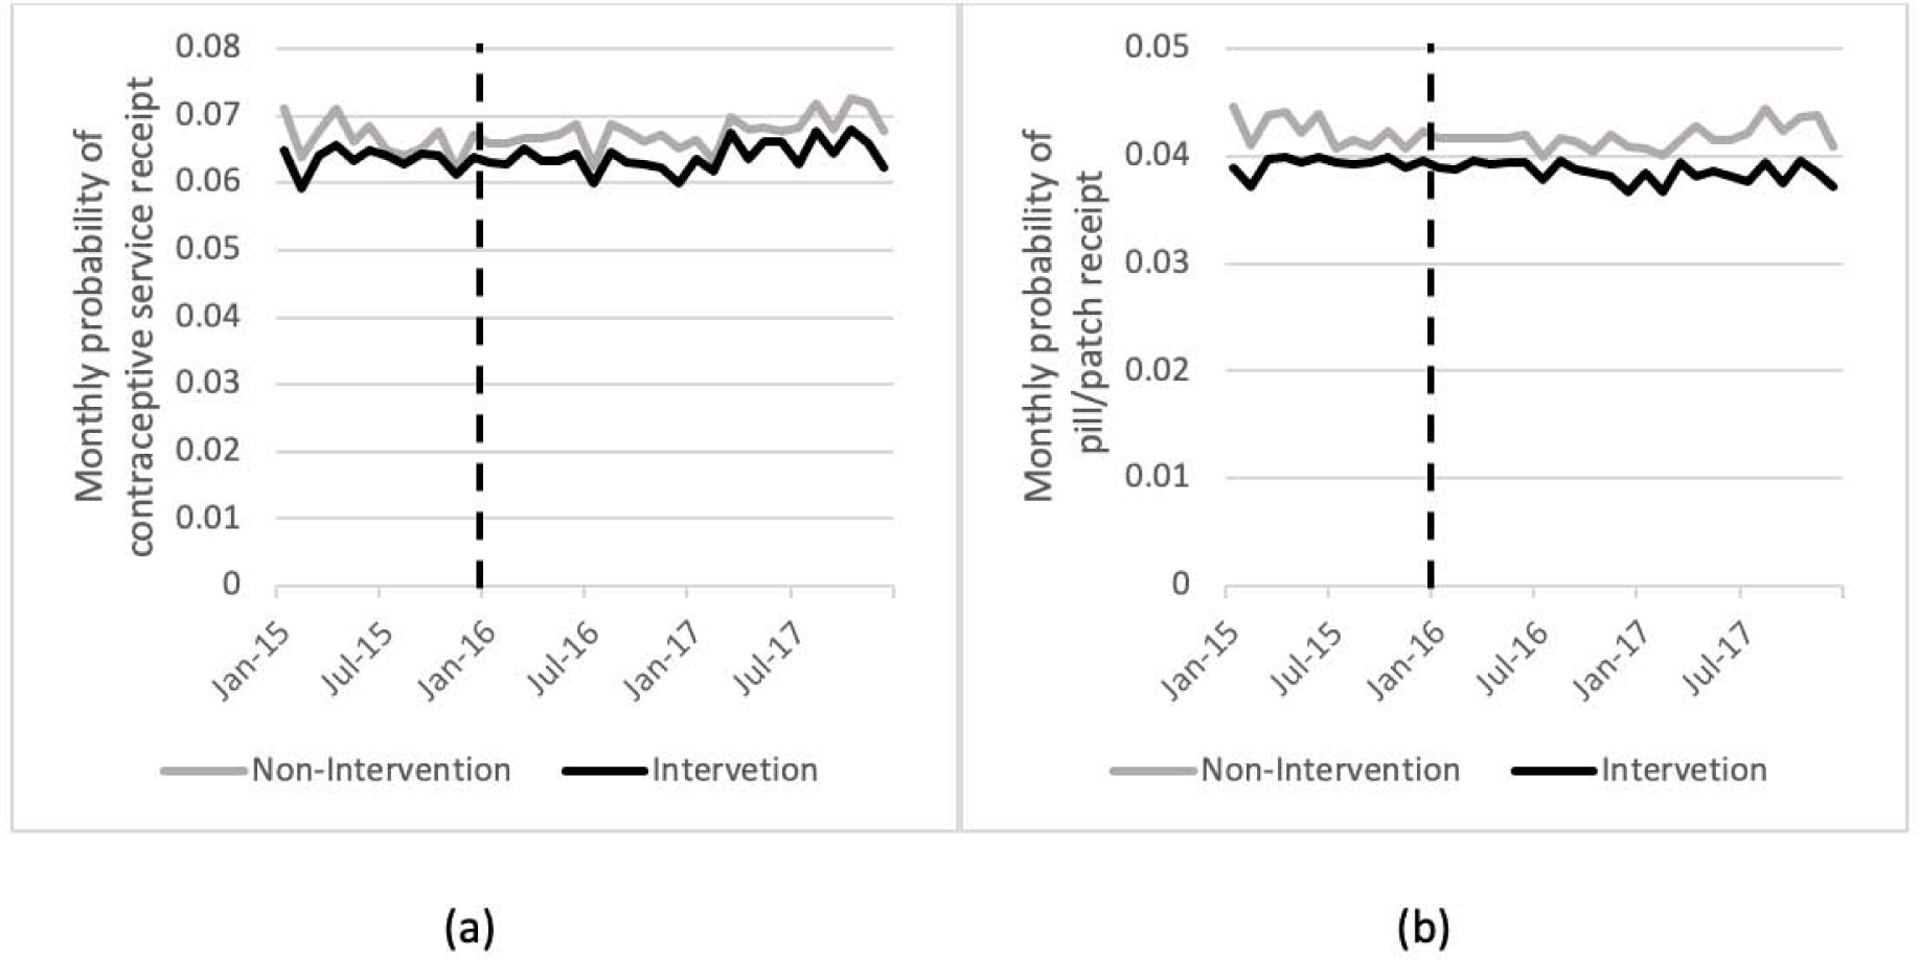
Figure 1.

Monthly probabilities (2015–2017) among all Medicaid-enrolled women ages 15–44 of (a) receiving any contraceptive service and (b) filling prescriptions for the pill or patch. Intervention and non-intervention areas are those with and without pharmacist prescribing available. Vertical dashed line indicates pharmacy access policy implementation.
