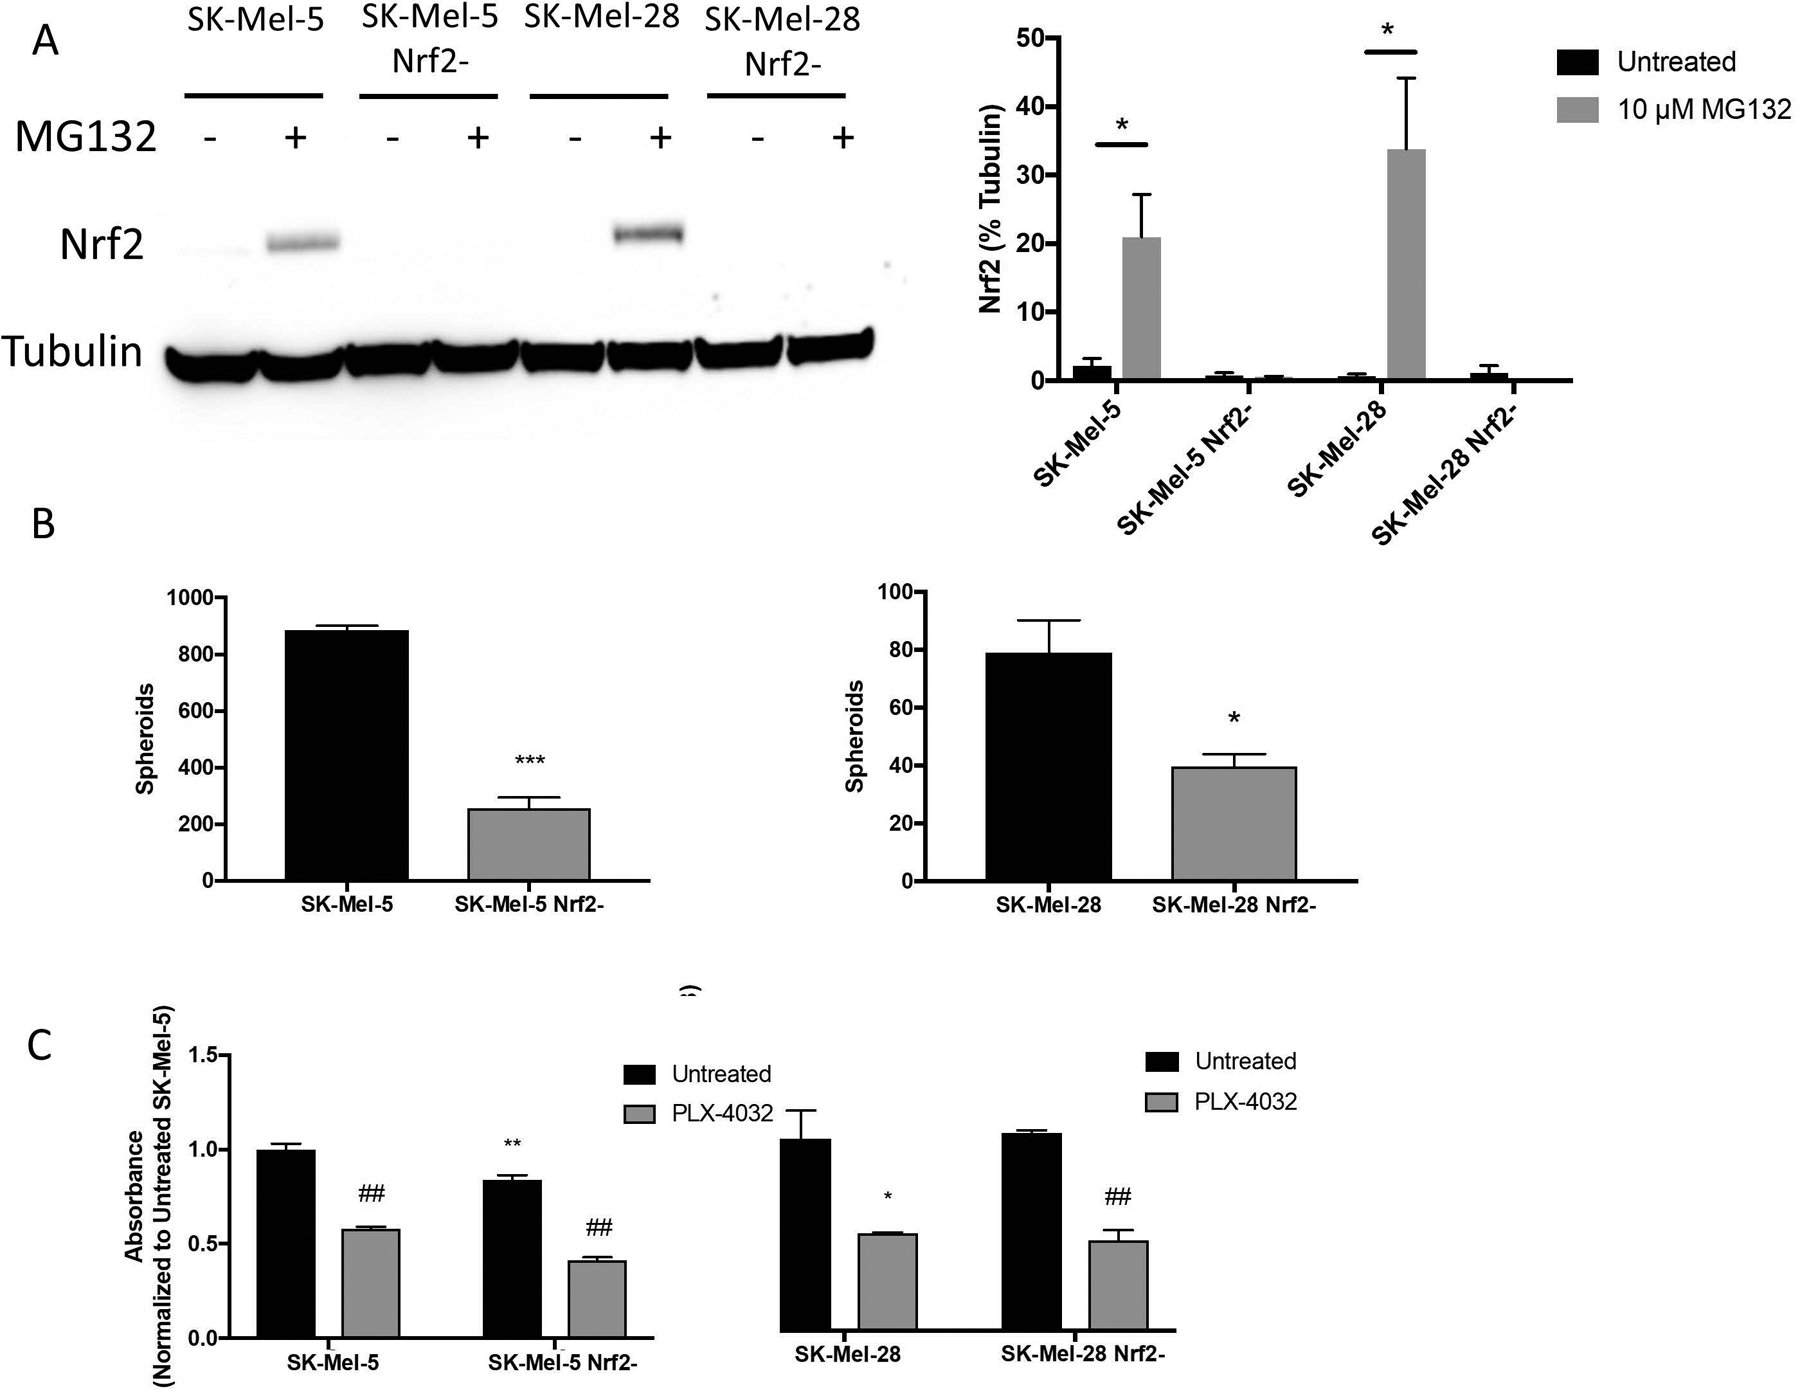
Figure 2. Loss of Nrf2 diminishes melanosphere formation.

SK-Mel-5 and SK-Mel-28 cells were transfected with CRISPR/Cas9 constructs to ablate Nrf2 expression. Transfected cells were sorted by GFP expression and individual clones were expanded. (A) Complete loss of Nrf2 was validated by immunoblot analysis following MG132 treatment (10 μM for 6 hours) to stabilize Nrf2 protein levels. Representative blot shown in the left panel. In the right panel, band intensity of three blots was measured and normalized to tubulin. (B) Melanosphere formation was assessed for SK-Mel-5, SK-Mel-28 and their Nrf2-null counterparts. (C) For the MTT assay, 10,000 cells were plated per well of a 96-well plate and treated with or without 5 μM PLX-4032 to inhibit B-RafV600E. After 48 hours, the MTT assay was conducted as described in Materials and Methods. Comparisons between wild-type and Nrf2-null lines are noted with asterisks. Comparisons between treated and untreated cells are noted by ## (P < 0.01). Error bars represent the standard error of the mean (SEM) of three biological replicates for immunoblot quantitation, four for the melanosphere assay and six for the MTT assay. Statistical significance was determined using the standard Student’s t-test. *P < 0.05, **P < 0.01, ***P < 0.001.
