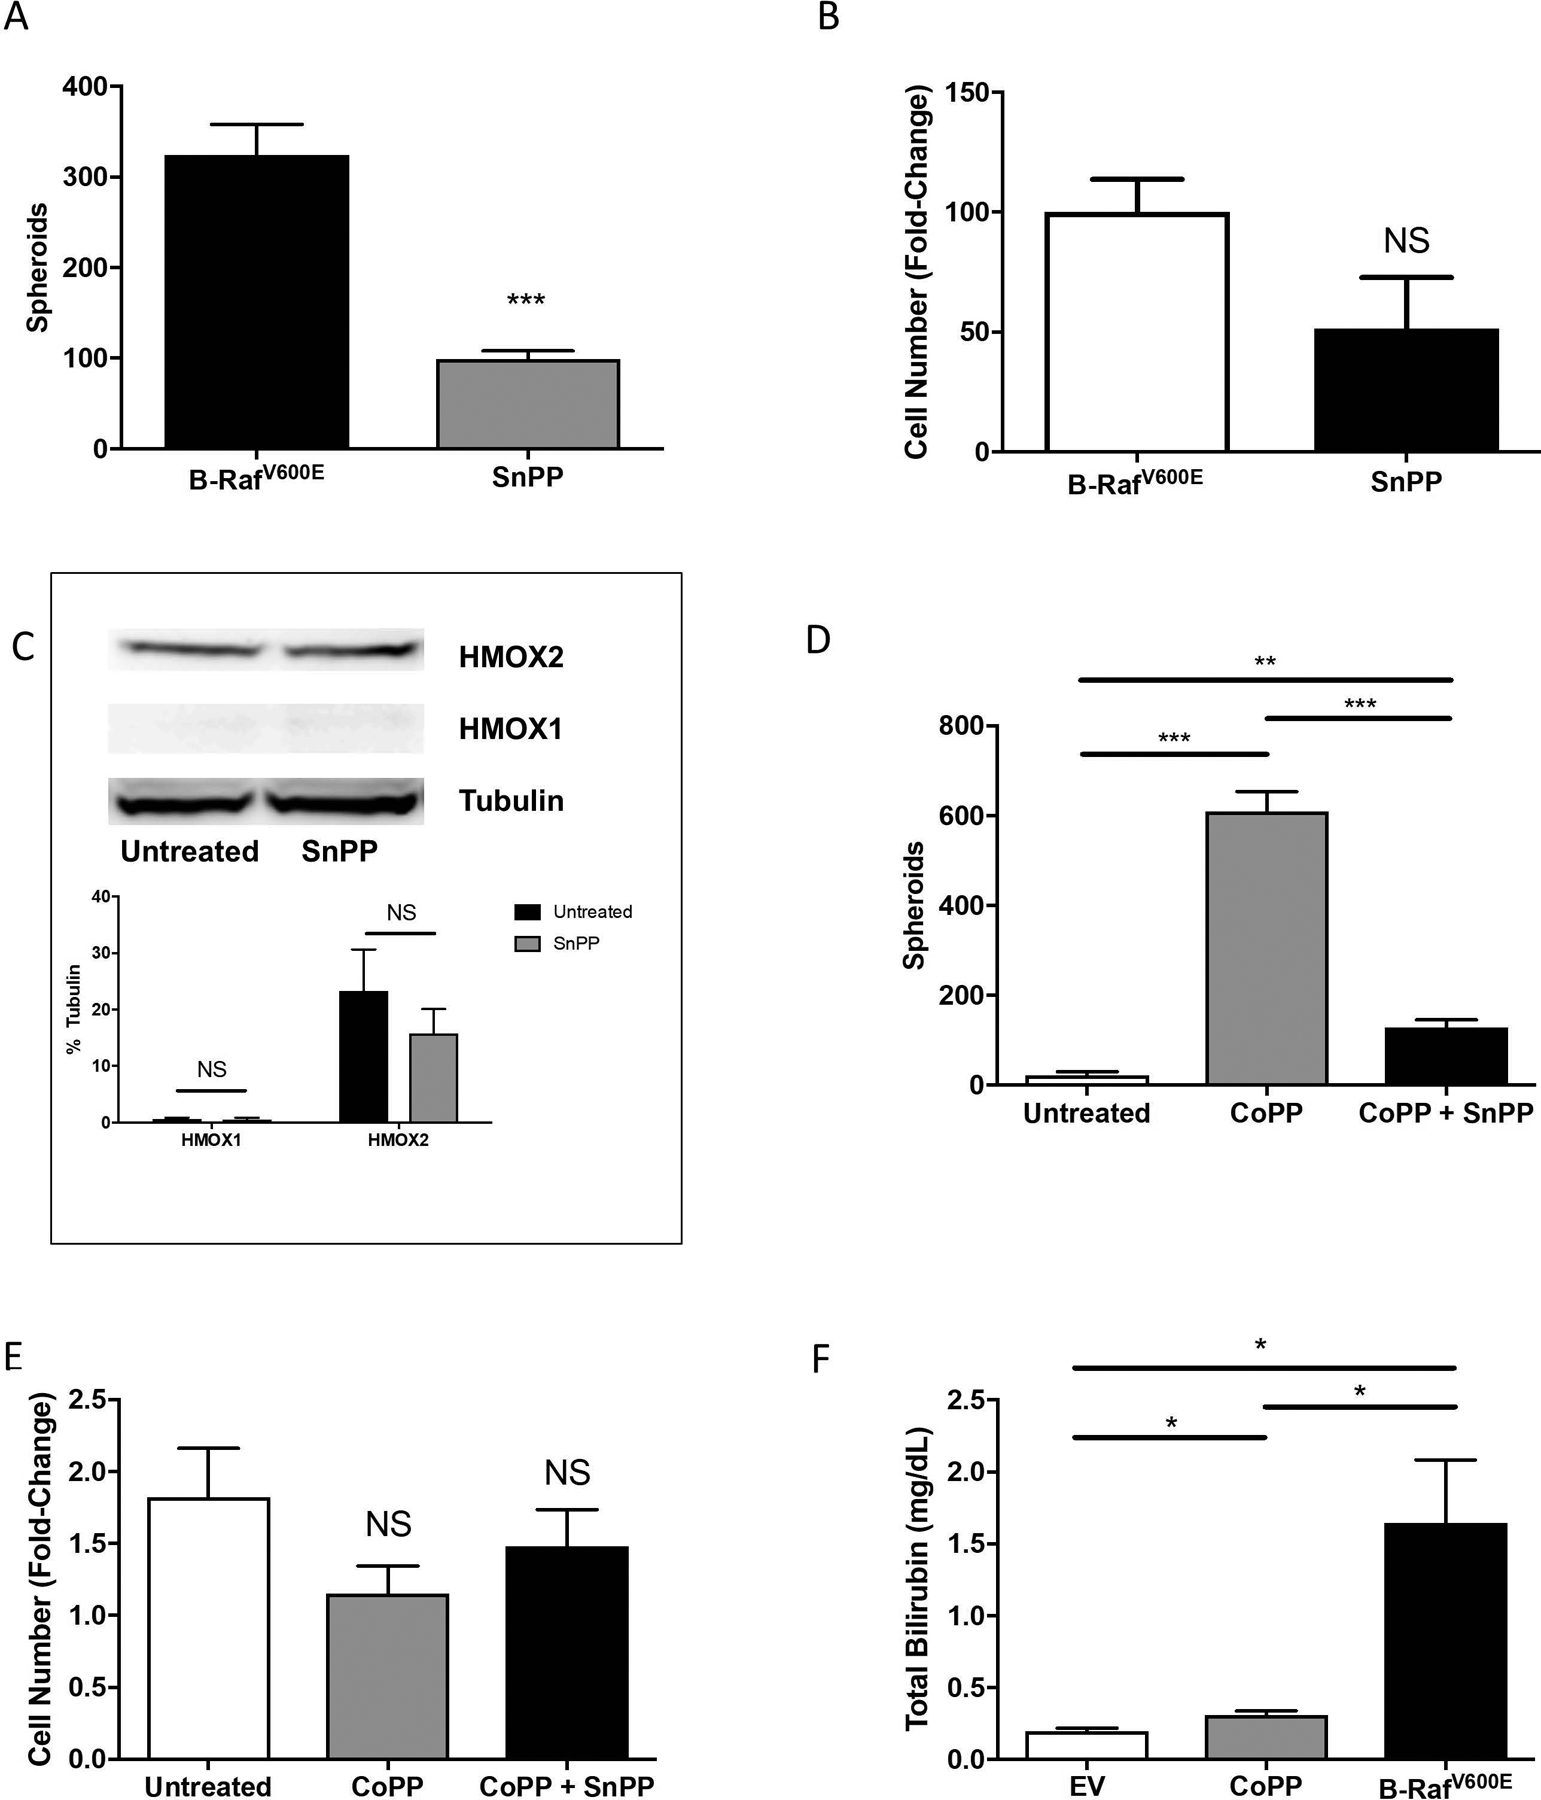
Figure 8. Pharmacological inhibition of HMOX1 and HMOX2 diminishes melanosphere formation in transformed Hs936T cells.

(A) Transformed Hs936T cells stably expressing B-RafV600E were either untreated or treated with 10 μM tin protoporphyrin IX dichloride (SnPP) every 48 hours to inhibit both HMOX1 and HMOX2 activity. Melanosphere formation was assessed as compared to untreated cells. (B) Following the 10-day melanosphere assay, all cells were collected, melanospheres were dissociated by incubation with TrypLE and cells were counted. Error bars represent the SEM of four biological replicates for each melanosphere assay. (C) Immunoblot analysis for Hs936T cells stably expressing B-RafV600E either untreated or treated with SnPP overnight was done to assess protein levels of HMOX1 and HMOX2. Band intensities were measured and normalized to tubulin. Error bars represent the SEM of three biological replicates. (D) Hs936T cells were either untreated, treated with 10 μM CoPP or treated with 10 μM CoPP plus 10 μM SnPP and melanosphere formation assessed. SnPP was added every 48 hours while CoPP was only added on day one of the melanosphere assay. (E) Melanospheres were dissociated and cells counted as described for (B). (F) Heme degradation levels were assessed by measuring total bilirubin in Hs936T cells stably expressing an empty pBABE vector (EV) and either untreated or treated with 10 μM CoPP overnight and in Hs936T cells stably expressing B-RafV600E. Error bars represent the SEM of three biological replicates. All statistical significance was determined using a standard Student’s t-test. *P < 0.05, **P < 0.01, ***P < 0.001, NS is not significant.
