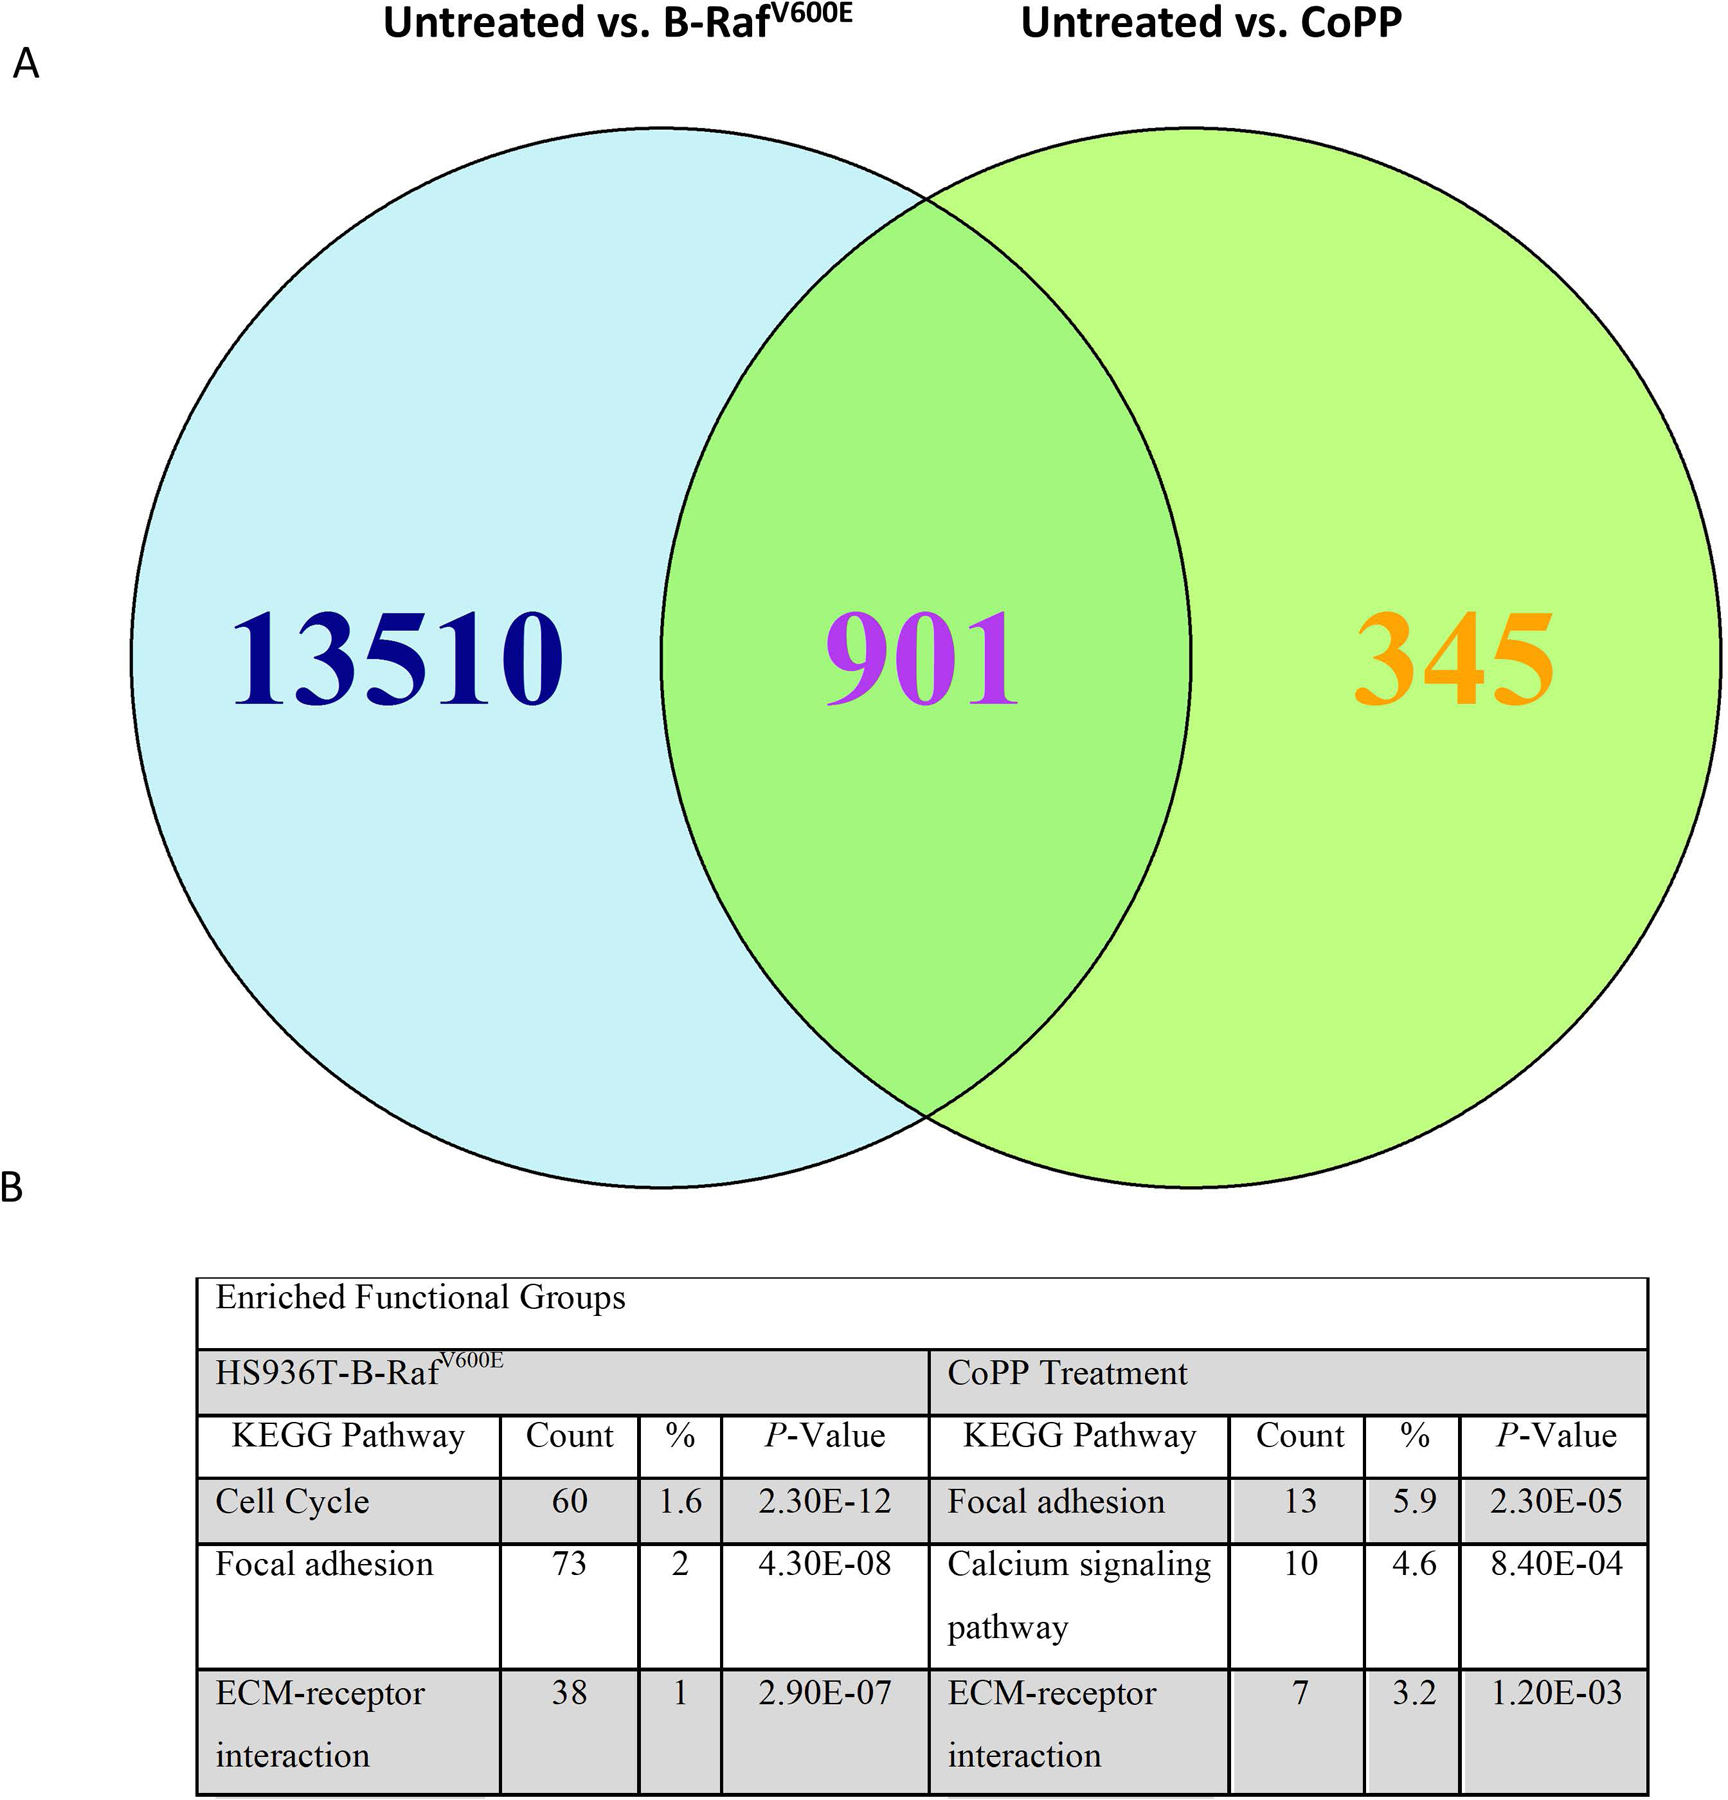
Figure 9. Hs936T cells treated with CoPP or stably expressing the active form of B-Raf, B-RafV600E, have up-regulated expression of genes involved in focal adhesion and ECM-receptor interaction.

Cells grown in suspension for 4 days were collected and mRNA isolated for high throughput RNA sequencing. Triplicate samples for each treatment group were sequenced. Since CoPP treatment and Hs936T cells stably expressing B-RafV600E both cause melanosphere formation, we were interested in where the global transcriptome signatures overlapped. (A) DESeq and EdgeR Bioconductor packages were used to identify differentially expressed transcripts that were up- or down-regulated at least 2-fold. Results indicate that 901 differentially expressed transcripts were similar between the B-RafV600E-expressing Hs936T cells and Hs936T cells treated with CoPP as compared to the untreated empty vector-expressing Hs936T cells. (B) DESeq and EdgeR identified 6,997 transcripts and 357 transcripts for B-RafV600E-expressing Hs936T cells and CoPP-treated Hs936T cells, respectively, which had at least a 2-fold increase in expression as compared to untreated Hs936T cells. These genes were used for DAVID functional annotation clustering. The top three enriched functional groups, sorted by P-value, are shown above. P-values are from a modified Fisher’s Exact Test (EASE Score). “Count” = the number of genes from the total list of up-regulated genes that are represented in this functional group; “%” = the percentage of genes from the total list of up-regulated genes that are represented in that functional group.
