
Figure 2. Bubble generation and concentration of protein.
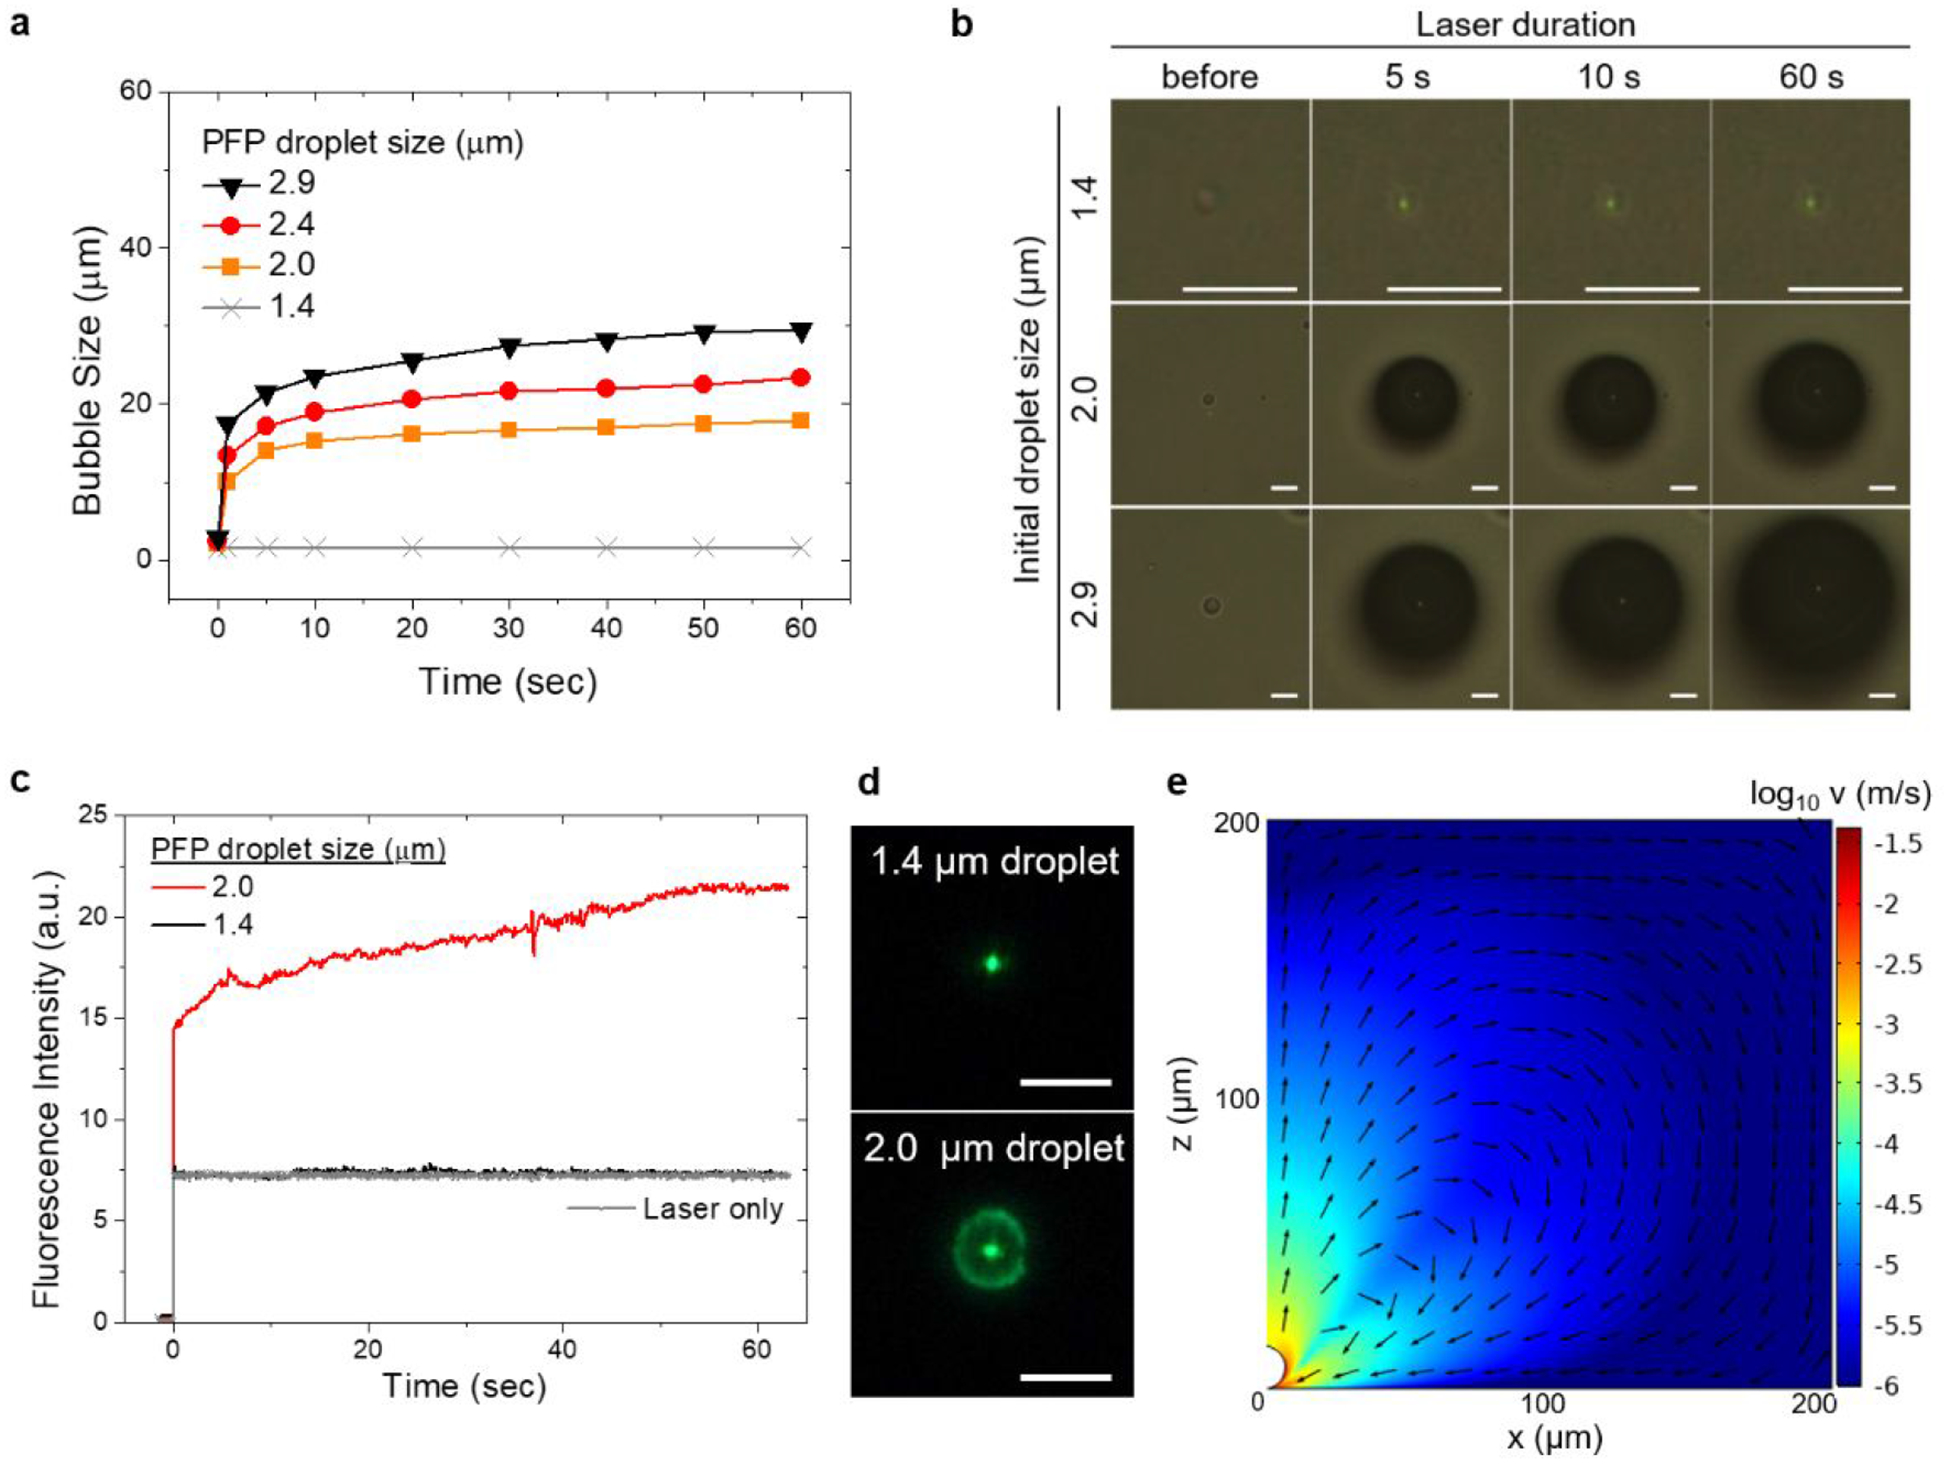
(a) Growth behavior of bubbles arising from PFP droplets with different diameters. (b) A series of optical images showing the evolution of bubbles arising from PFP droplets with different diameters (scale bar: 5 μm). (c) Temporal evolution of fluorescence intensity (FITC-anti rabbit IgG, 10 μg/mL in PBS) around the laser spot for two PFP droplets of different sizes and (d) corresponding fluorescence images after 60 seconds of bubble duration (scale bar: 5 μm). The zero timepoint indicates the light incident. Fluorescence intensity was measured from the defined region of interest around the laser spot. (e) Simulated velocity profile near the 15 μm bubble. Arrows indicate normalized velocity.