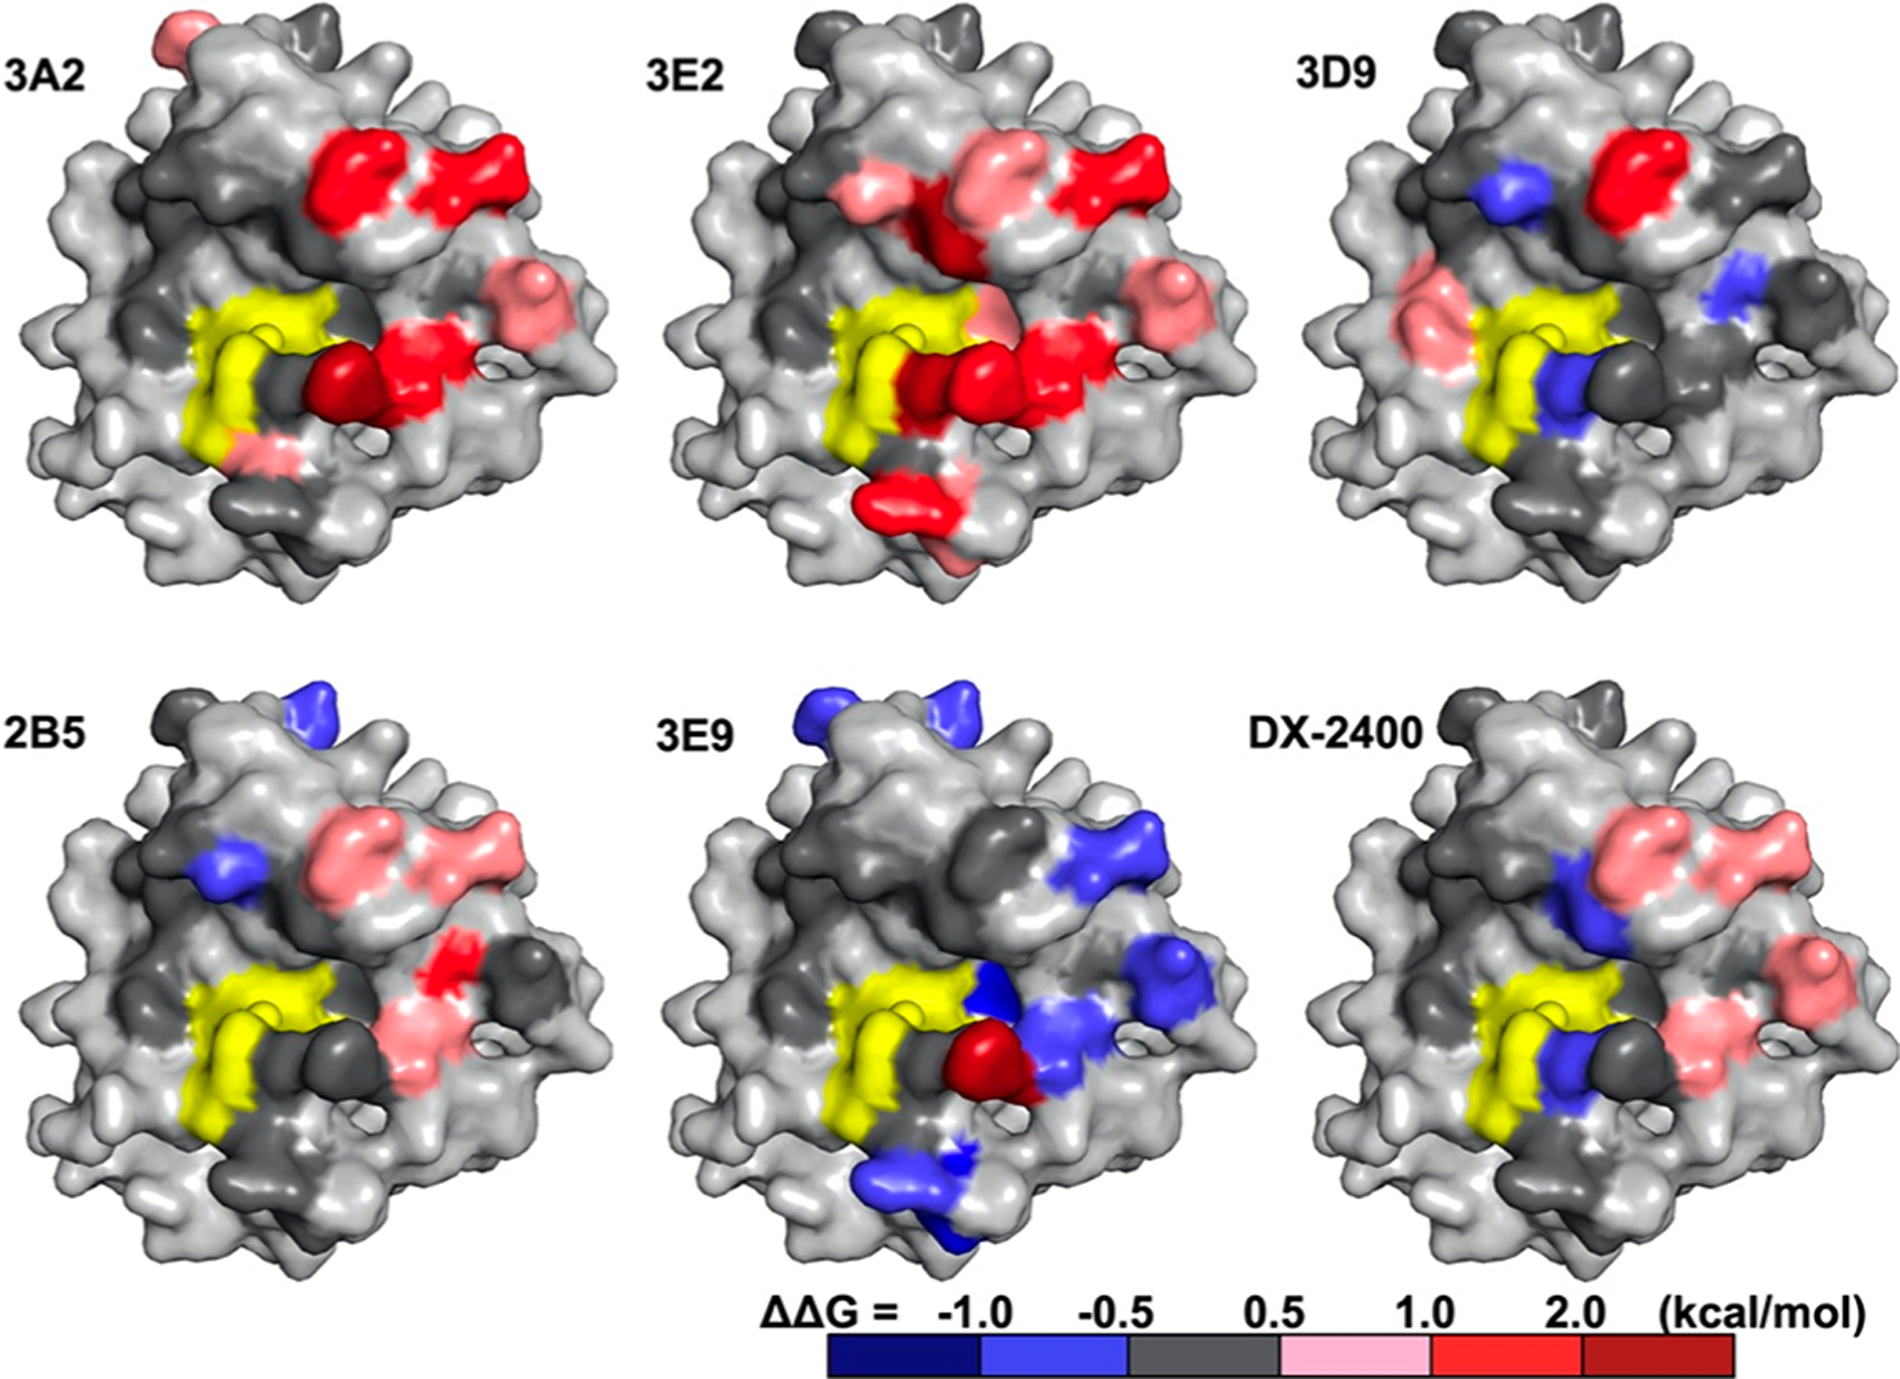
Figure 6.

Epitope mapping by alanine scanning mutagenesis. Point mutants that had a positive ΔΔG(mut‑wt) (increased IC50) are colored pink (0.5–1.0 kcal/mol), red (1.0–2.0 kcal/mol), and brown (>2.0 kcal/mol), and mutants that had a negative ΔΔG(mut‑wt) (decreased IC50) are colored blue. Point mutants that had a minimal effect on IC50 [|ΔΔG(mut‑wt)| < 0.5 kcal/mol] are colored gray. The space-filling models are oriented in the same manner as in Figure 3, with the catalytic center colored yellow.
