
Figure 2: Assessing MELD × MD predictions for all 30 complexes.
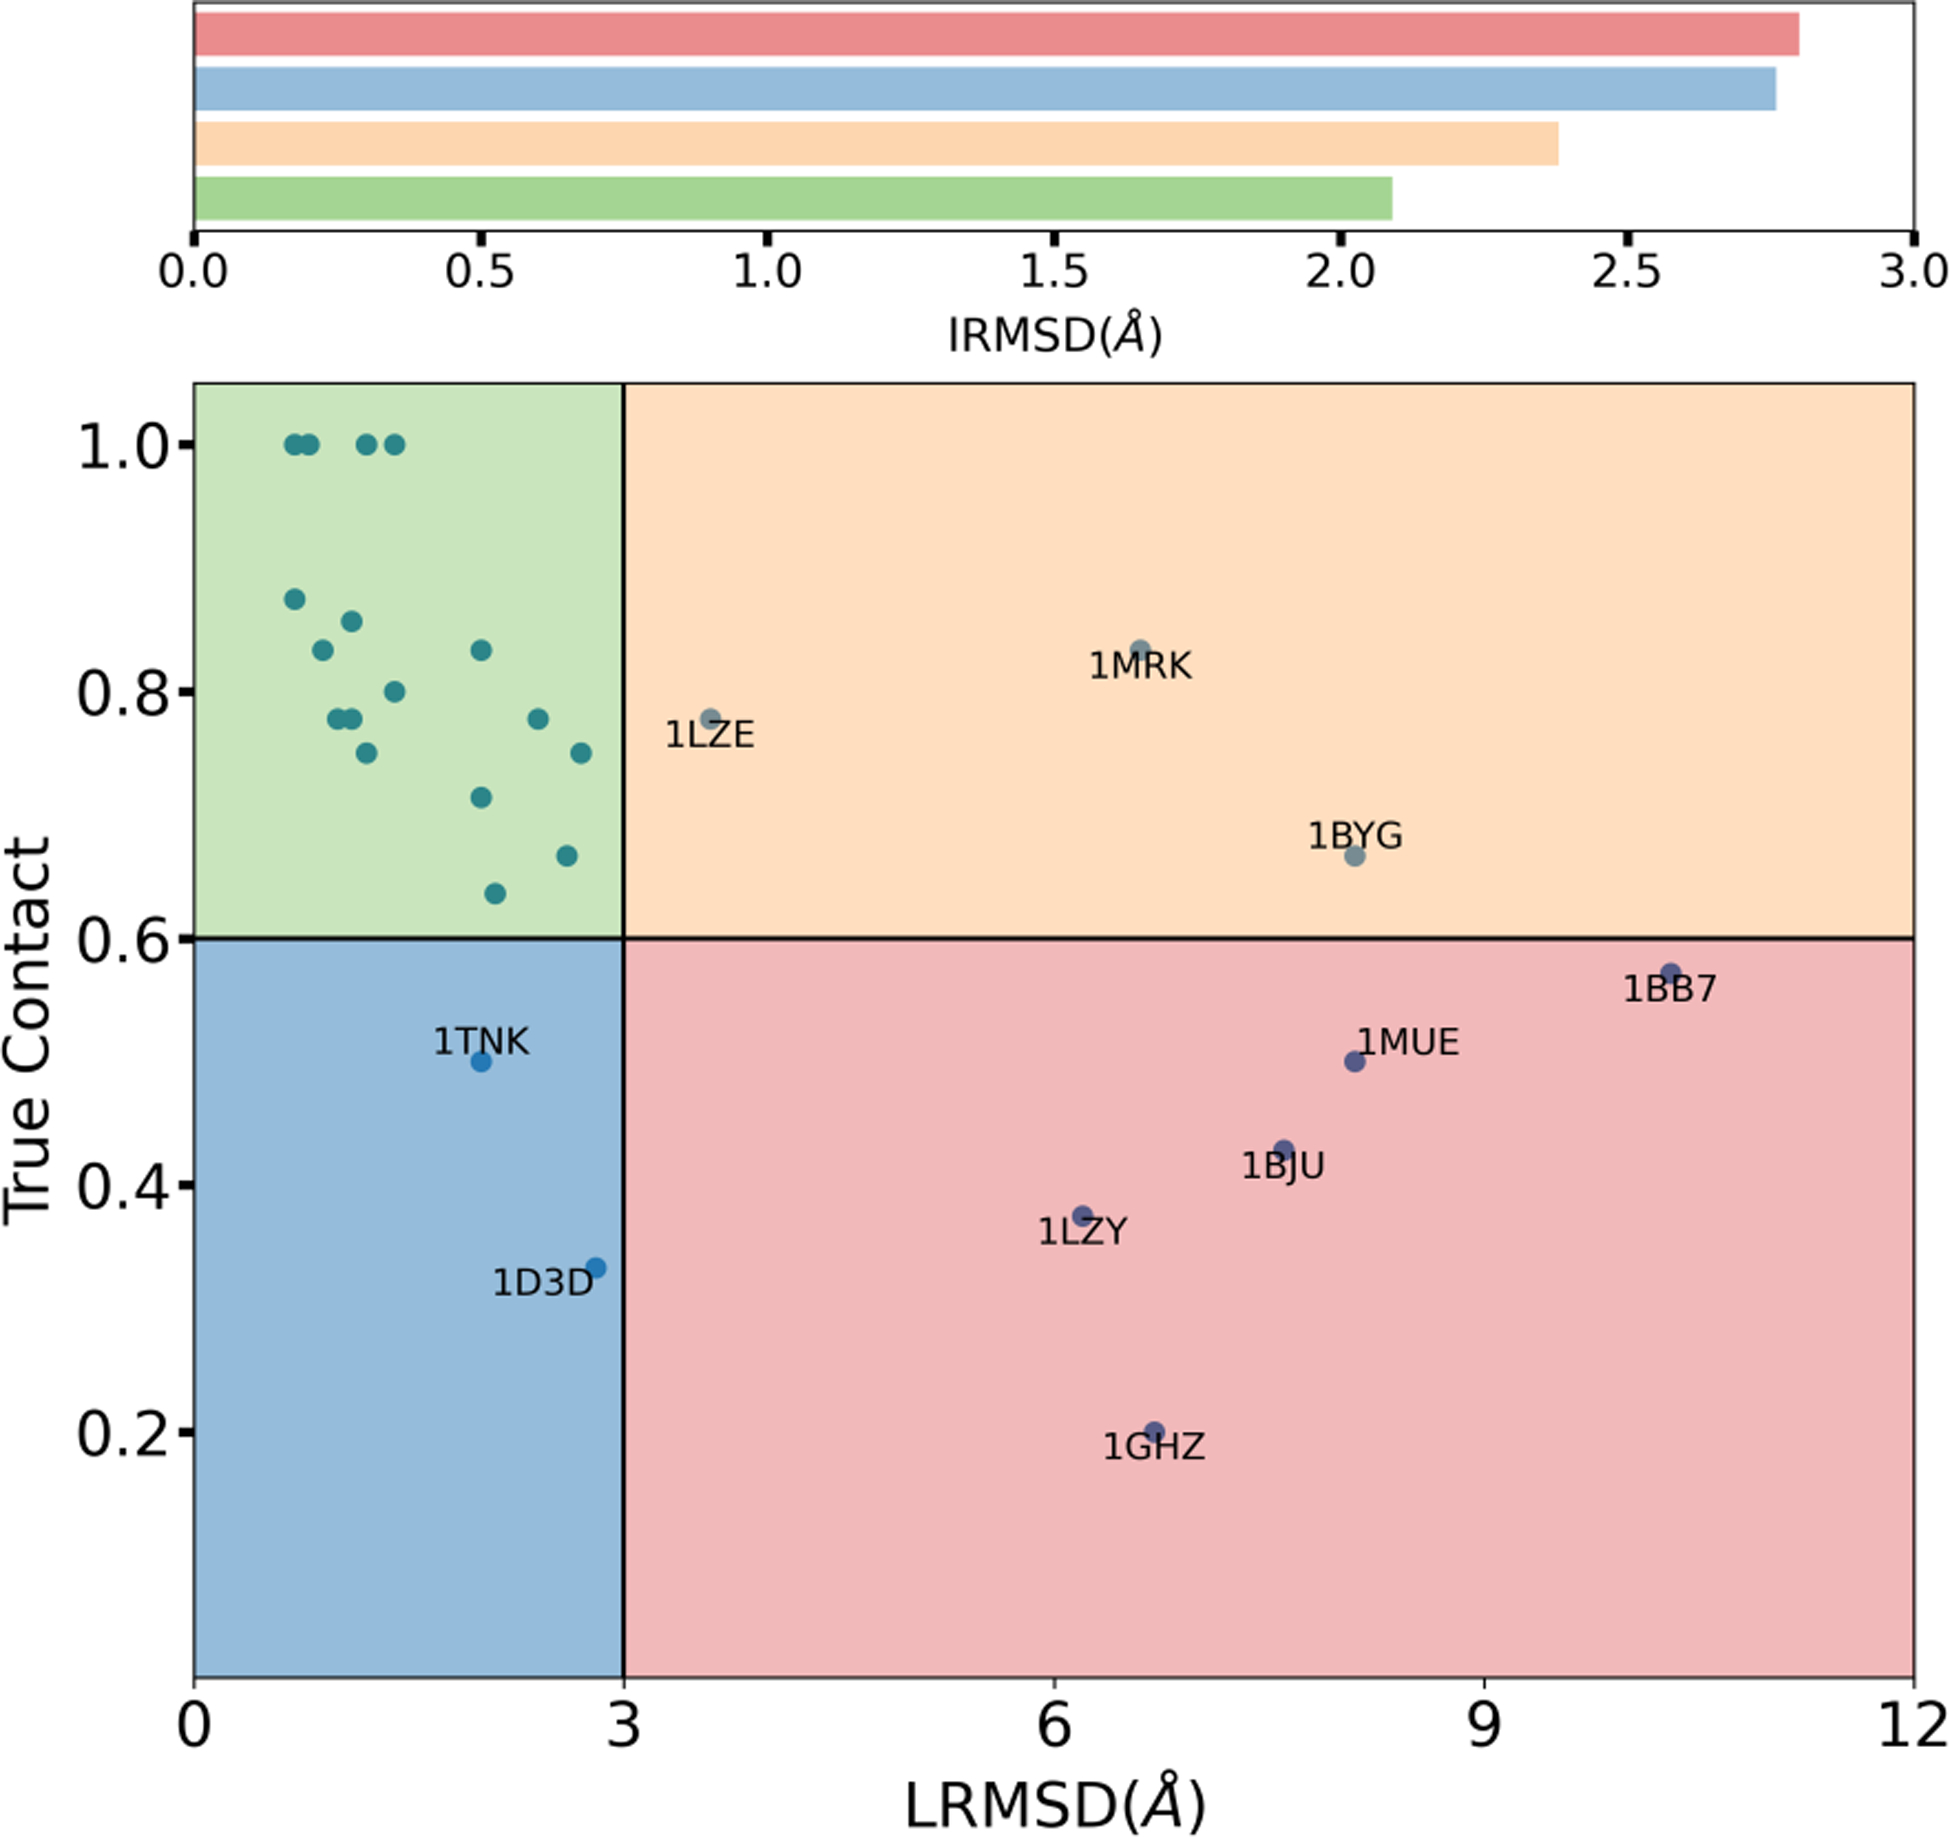
MELD × MD TOP1 predictions for all 30 complexes are partitioned into 4 different groups based the fraction of true contact and ligand root-mean-square distance(LRMSD). The average binding pocket flexibility across all complexes in each groups are accessed using interface root-mean-square distance (IRMSD) and the corresponding bar plot is shown on top.