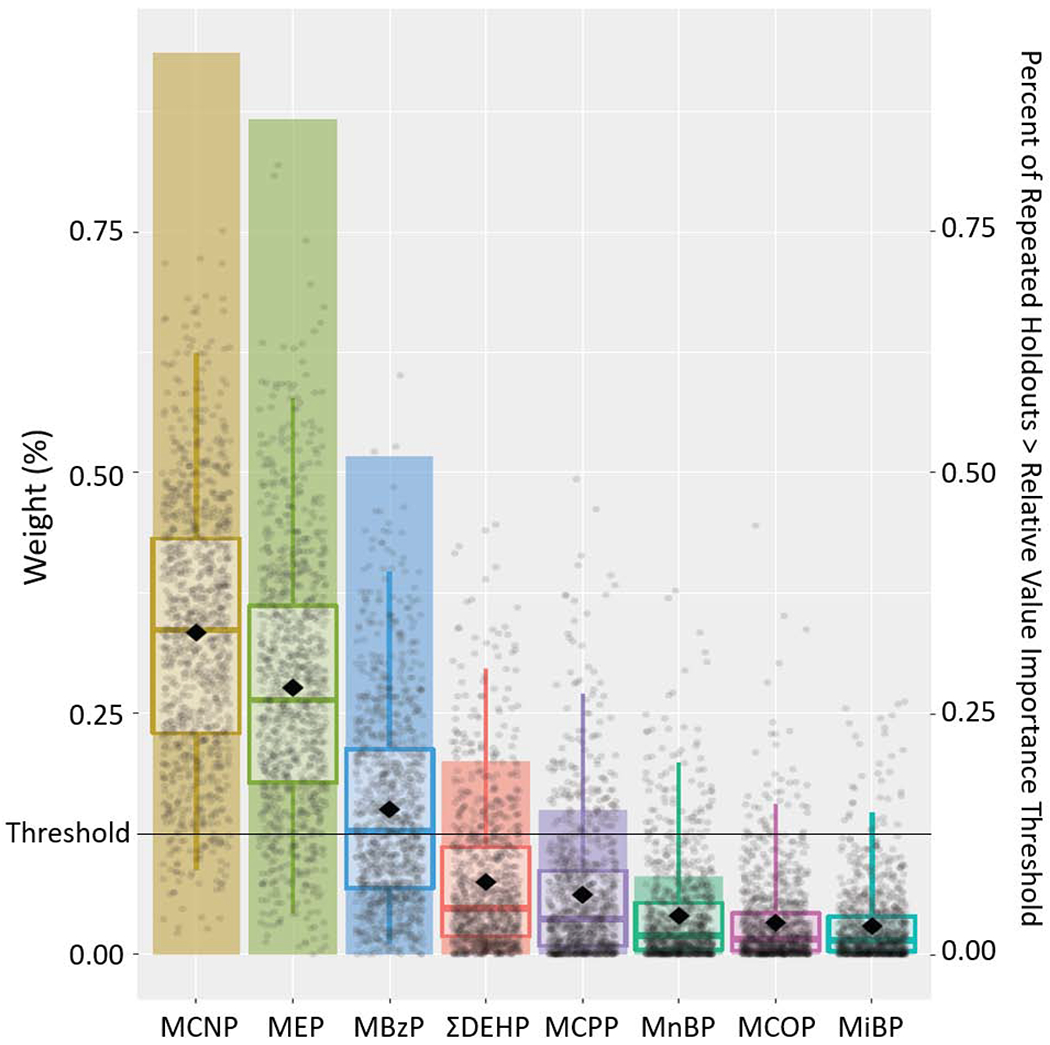
Figure 2.

Results from Weighted Quantile Sum Regression Analysis with 1,000 Iterations on Childhood Exposure to Phthalate Mixture and Internalizing Problem Composite Scale: Relative Weights of Each Phthalate Metabolite and Percent of Repeated Holdouts Above Relative Variable Importance Threshold (N=228).
Note: Each individual dot represents weight for a given metabolite from a single repeated holdout. Box-and-whisker plots describe univariate statistics of these weights from 1,000 repeated holdouts. Bar height indicates the proportion of repeated holdouts where the weight had a value above the relative variable importance threshold (0.125, i.e., 1/8). DEHP, summary di(2-ethylhexyl) phthalate metabolite measure; MnBP, mono-n-butyl phthalate; MBzP, monobenzyl phthalate; MCNP, monocarboxynonyl phthalate; MCOP, monocarboxyoctyl phthalate; MCPP, mono(3-carboxypropyl) phthalate; MEP, monoethyl phthalate; MiBP, mono-isobutyl phthalate.
Adjusted for maternal age at delivery, mother’s pre-pregnancy BMI, maternal gestational smoking (mean of log10-transformed serum cotinine concentrations during 16 and 26 weeks of pregnancy), mother’s Beck’s Depression Inventory score, gestational alcohol consumption (<1/month, >1/month, binge), maternal education (high school graduate or less, tech school or some college, college graduate or above), marital status (married, unmarried), and child’s sex (male/female), race (non-Hispanic White, non-Hispanic Black, other), and age at outcome assessment.
