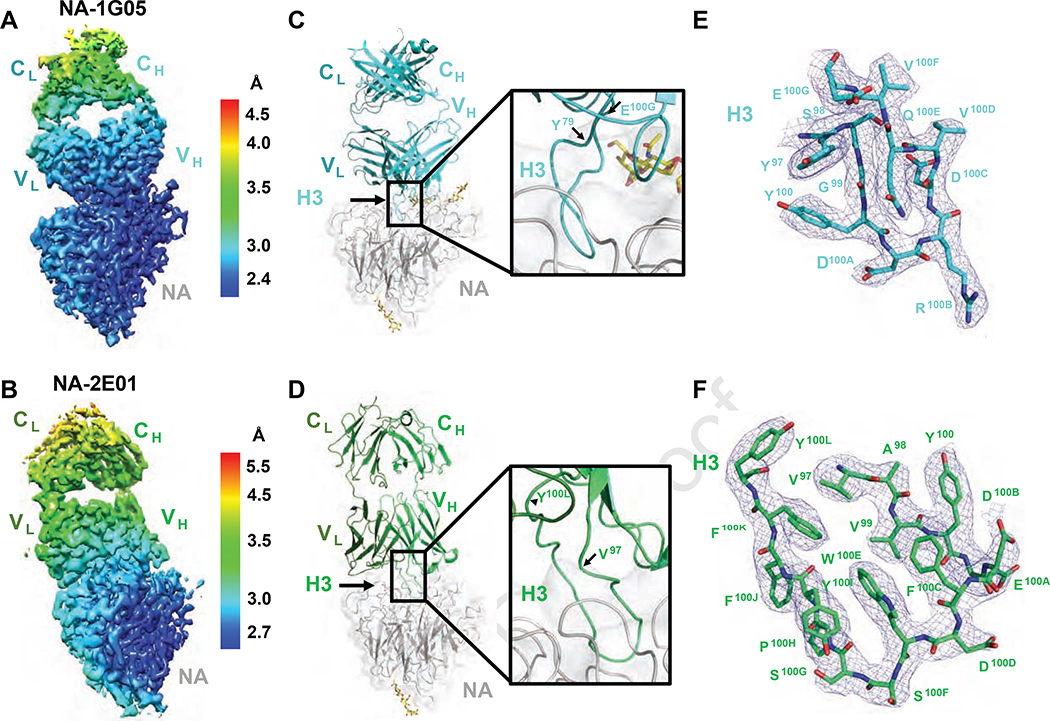
Figure 5. Atomic models of NA-1G05 and NA-2E01 complexes.
(A, B) Local resolution of the map of one monomeric subunit of NA bound with one 1G05 (A) and one 2E01 (B) Fab.
(C, D) Ribbon diagrams of one monomeric subunit of NA bound with 1G05 (C) and 2E01 (D) in the same orientations as in (A) and (B), respectively. Gray, NA; cyan, 1G05 heavy chain; teal, light chain (C). Green, 2E01 heavy chain; dark green, light chain (D). N-linked glycan moieties are shown as yellow sticks.
(E, F) Electron density maps and atomic models of 1G05 (E) and 2E01 (F) CDR-H3 (contour level at 5.0 σ). See also Figures S5 and S6.

