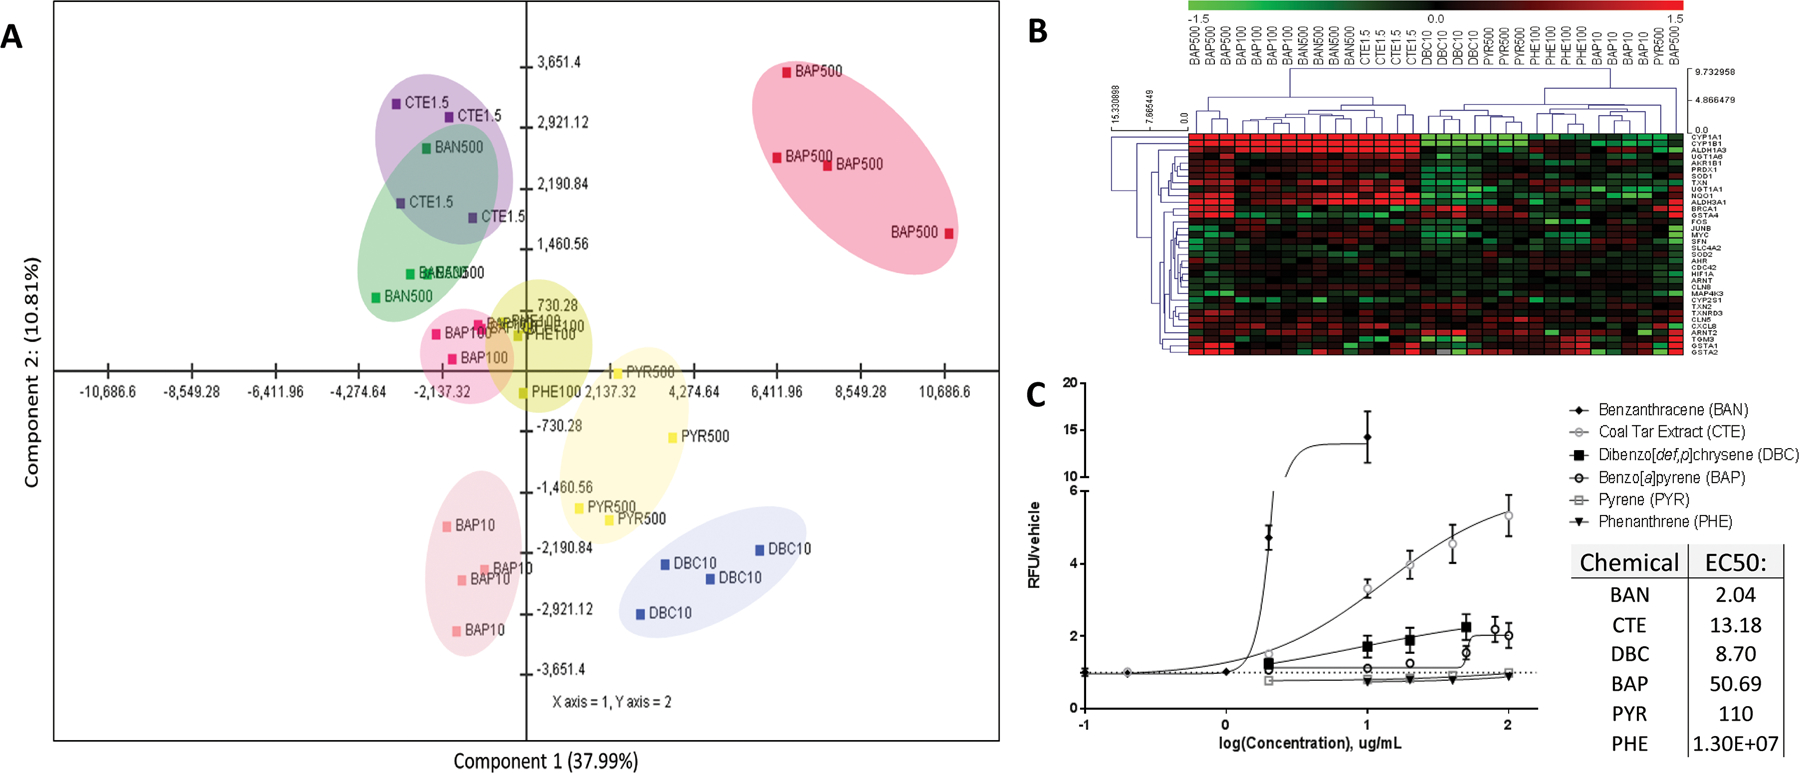
Figure 1. Differential effects of PAHs in human bronchial epithelial cells. (A) Principal components analysis (PCA) of global gene expression of HBEC exposed to PAHs.

The horizontal axis represents PC 1 and the vertical axis represents PC 2. The captured variance of these first 2 components account for 47.22% of the total variance, and variance-correlation of gene expression resulted in variable clustering of PAHs. (B) Transcriptional regulation of genes by PAHs. Comparison of gene expression using RNASeq. Subsets of genes associated with xenobiotic metabolism, AhR signaling, oxidative stress, and cell cycle regulation were highlighted in a heatmap. Values are log2-fold change for all treatments compared with experimental control; red, green, and black represent upregulated, downregulated, and unchanged genes, respectively. (C) Intracellular ROS generation as measured by DCFDA. Chemical-induced fluorescence was expressed as relative fluorescence (RFU) normalized to vehicle control (RFU/vehicle), and the data were fit to a nonlinear regression with variable slope to model dose-response curves and calculate EC50s.
