
Figure 2. Pathway enrichment analysis of differentially regulated genes by PAH and PAH mixture exposure.
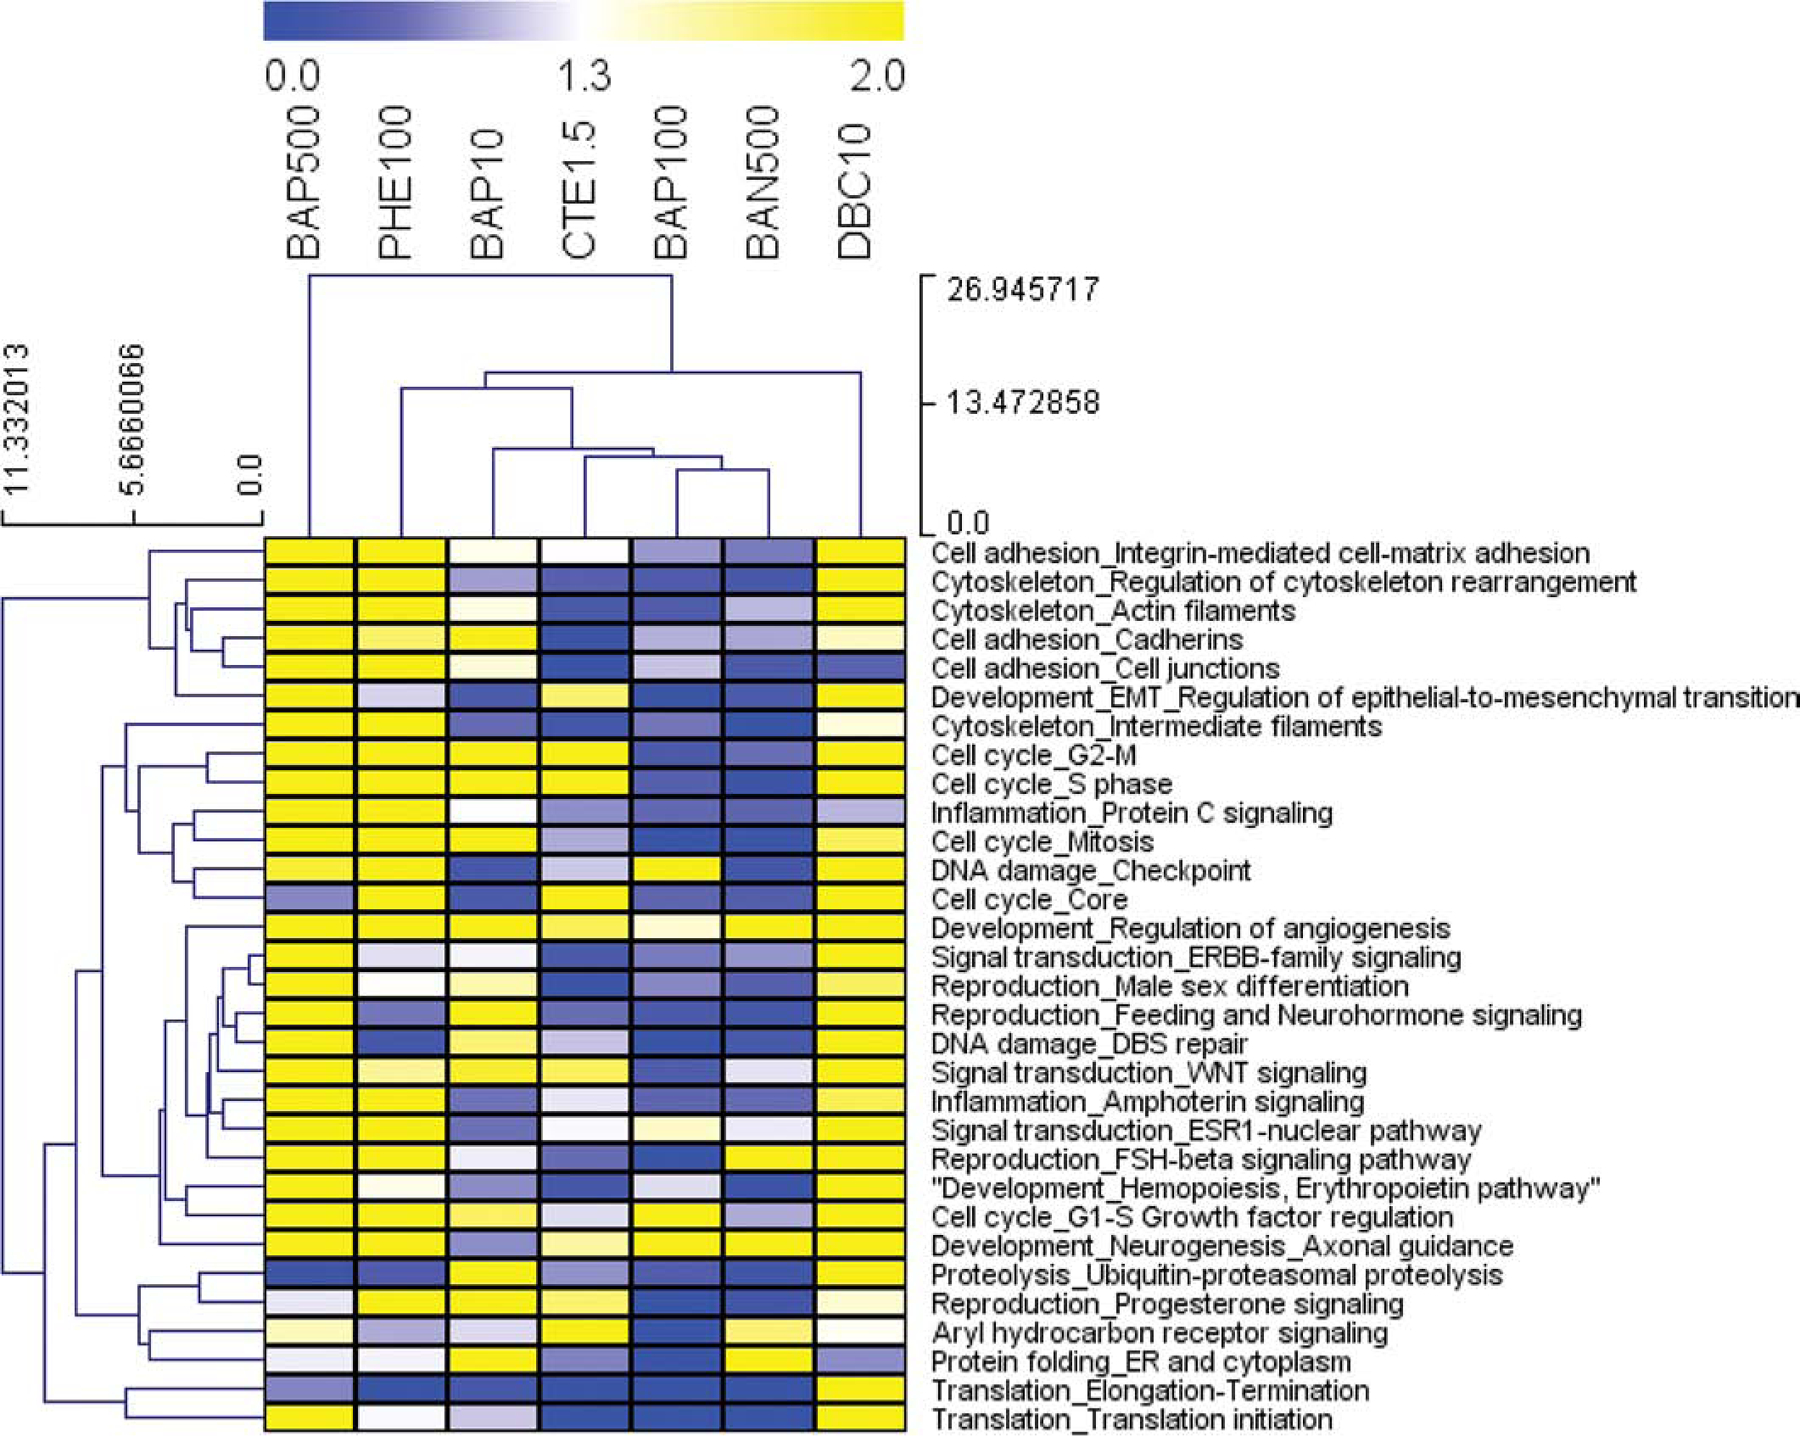
Functional enrichment analysis was performed in MetaCore (GeneGO, Thomson Reuters) based on mapping of the significant (p<0.05) genes in each treatment group onto built-in functional network processes. Heatmap visualizing the top 30 most differentially significant process networks (greatest std(−logpval) regulated by 7 PAH treatments (p<0.01 for at least one PAH group). Values are pval that have been transformed (−logpvalue) for pathway enrichment of treatments, where blue, white, and yellow represent −logpvalue = 0, 1.3 (p<0.05), and 2.0 (p<0.01), respectively.