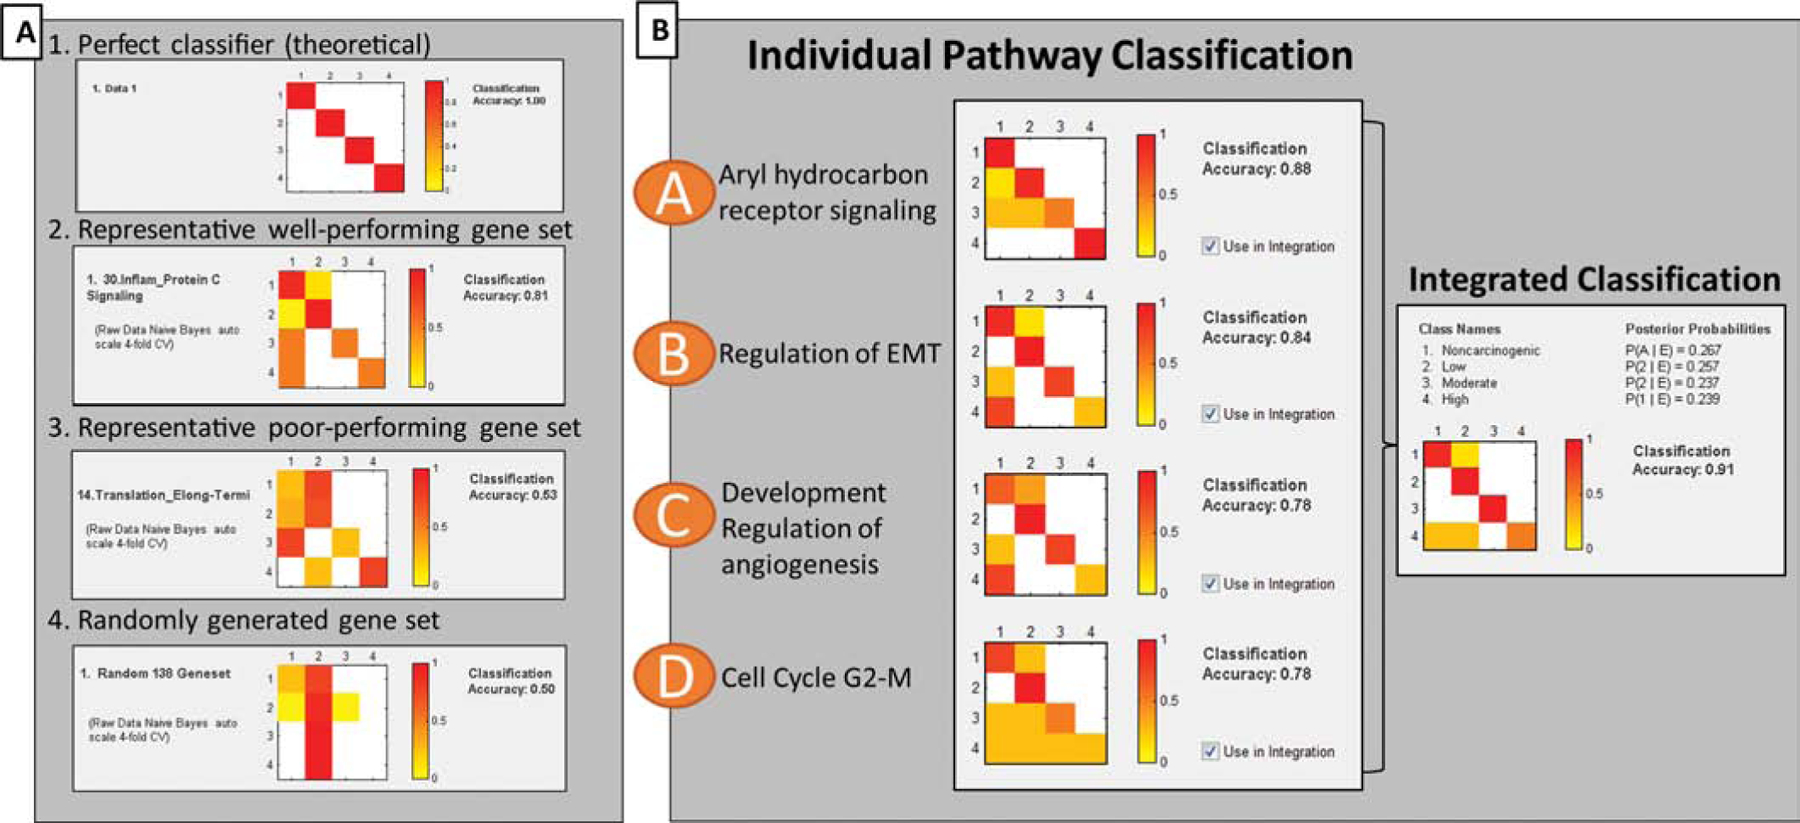
Figure 3. Classification of PAHs based gene sets.

Classification accuracy (CA) heatmaps of gene-based classification performance, where classes 1–4 indicate carcinogenic potency (non-carcinogenic, low, moderate, high). Colors indicate proportion of samples classified into specific classes, where red represents most or all samples, and white represents zero samples. Therefore, a theoretical perfect classifier results in a diagonal line of red squares. (A) Probability matrices for gene sets were calculated using Naïve Bayes statistical learning algorithm with 4-fold cross validation. Here, the CA heatmaps demonstrate the possible range of classification performance, from theoretically perfect classifiers (1.00) to randomly generated gene sets that do not classify better than random (0.50). (B) Bayesian integration of top-performing pathway gene sets. Integrated CA (0.91) is indicated on the right, and exceeds the individual CA performance of individual pathway gene sets.
