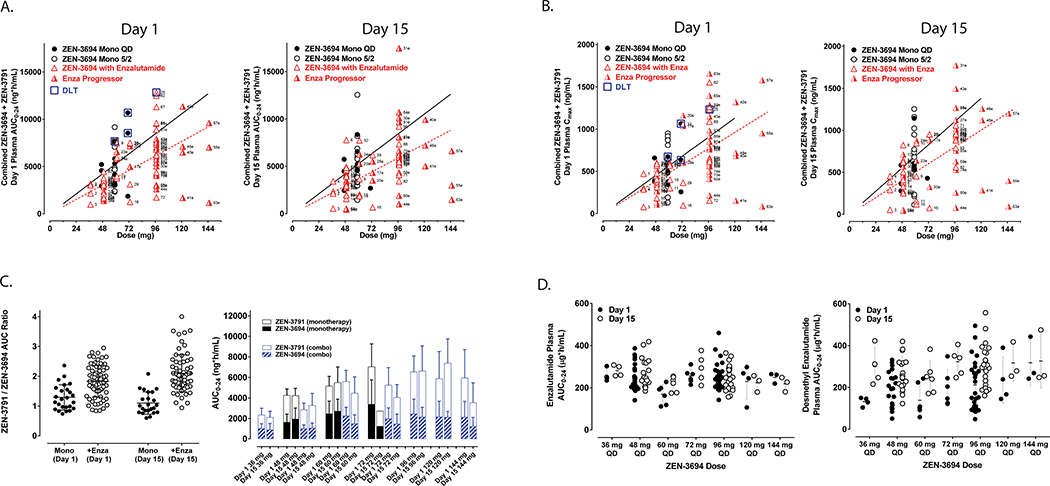
Figure 1. Pharmacokinetic analyses.
A and B. Area-under-the-curve (AUC) from 0 to 24 hours (AUC0–24) and maximum serum concentration, respectively, of ZEN-3694 + ZEN-3791 (first generation active metabolite) serum concentration on day 1 and day 15 of cycle 1 (red triangles). Overlaid AUC0–24 data from the monotherapy trial of ZEN-369423 are shown for dose levels 48 and 72 mg daily (black circles). C. Ratio of ZEN-3791 (first generation active metabolite) vs. ZEN-3694 (parent compound) from the prior monotherapy trial23 and in combination with enzalutamide on day 1 and day 15 of cycle 1. D. Steady-state serum concentration of enzalutamide and desmethylenzalutamide following 14 day lead-in of enzalutamide (day −14 to day −1), by ZEN-3694 dose level.

