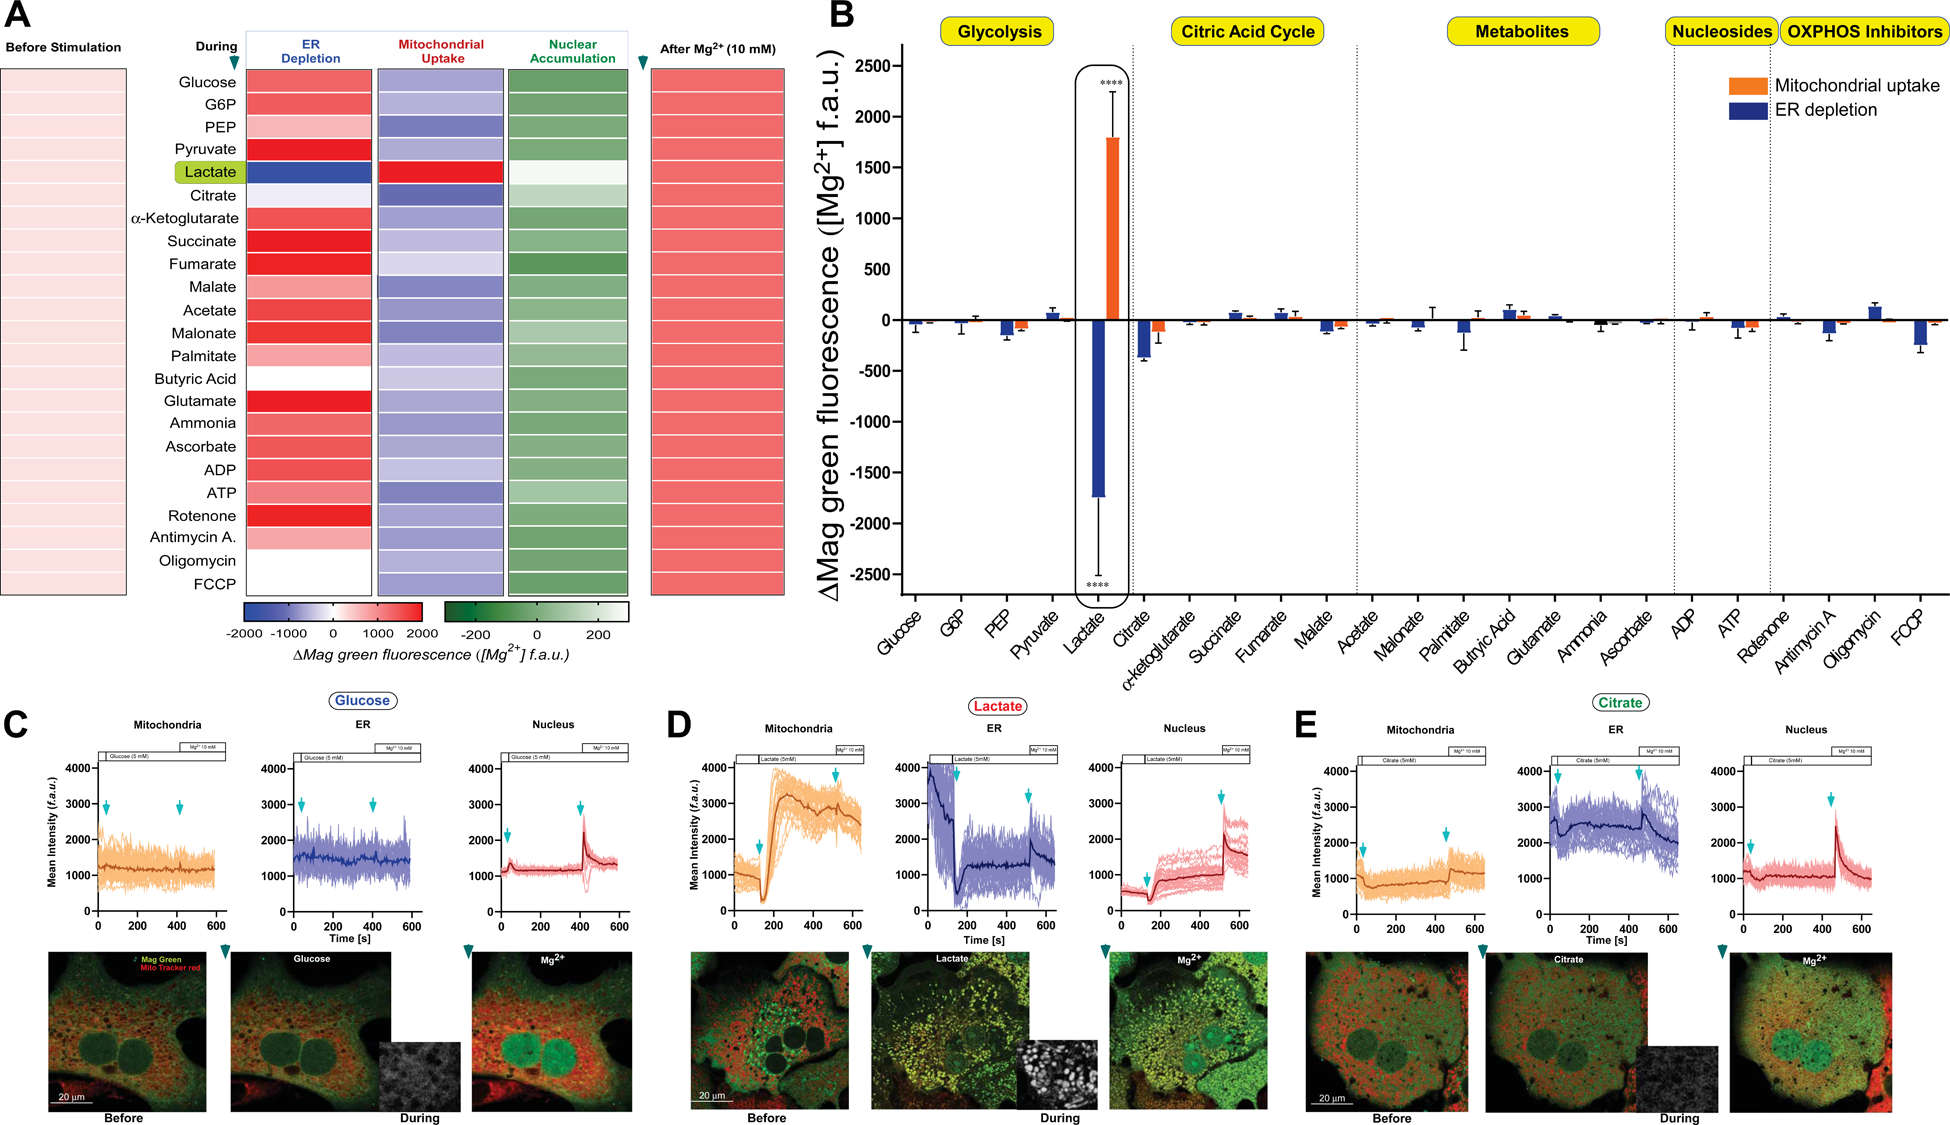
Figure 1. Lactate stimulates rapid depletion of ER magnesium stores and subsequent uptake by mitochondria.

(A) Primary hepatocytes were loaded with Magnesium Green AM (Mag-Green) and MitoTracker Red (mitochondrial marker) for live confocal imaging. Relative changes in fluorescence intensity of Mag-Green in the ER, nucleus, and mitochondria were analyzed and depicted as a heatmap. n=3–10.
(B) Quantitative analysis of relative changes in Mag-Green fluorescence intensity in ER (blue) and mitochondria (orange). n=3–10. Mean ± SEM. ****p < 0.0001.
(C-E) Representative images and traces of relative changes in Mag-Green intensity of mitochondrial (orange), ER (blue) and nuclear (red) regions.
(C) Glucose (5 mM), (D) sodium L-Lactate (5 mM), or (E) Citrate (5 mM) was added after a 30 second baseline recording followed by a 10 mM Mg2+ bolus at the 125th frame. n=3–6.
