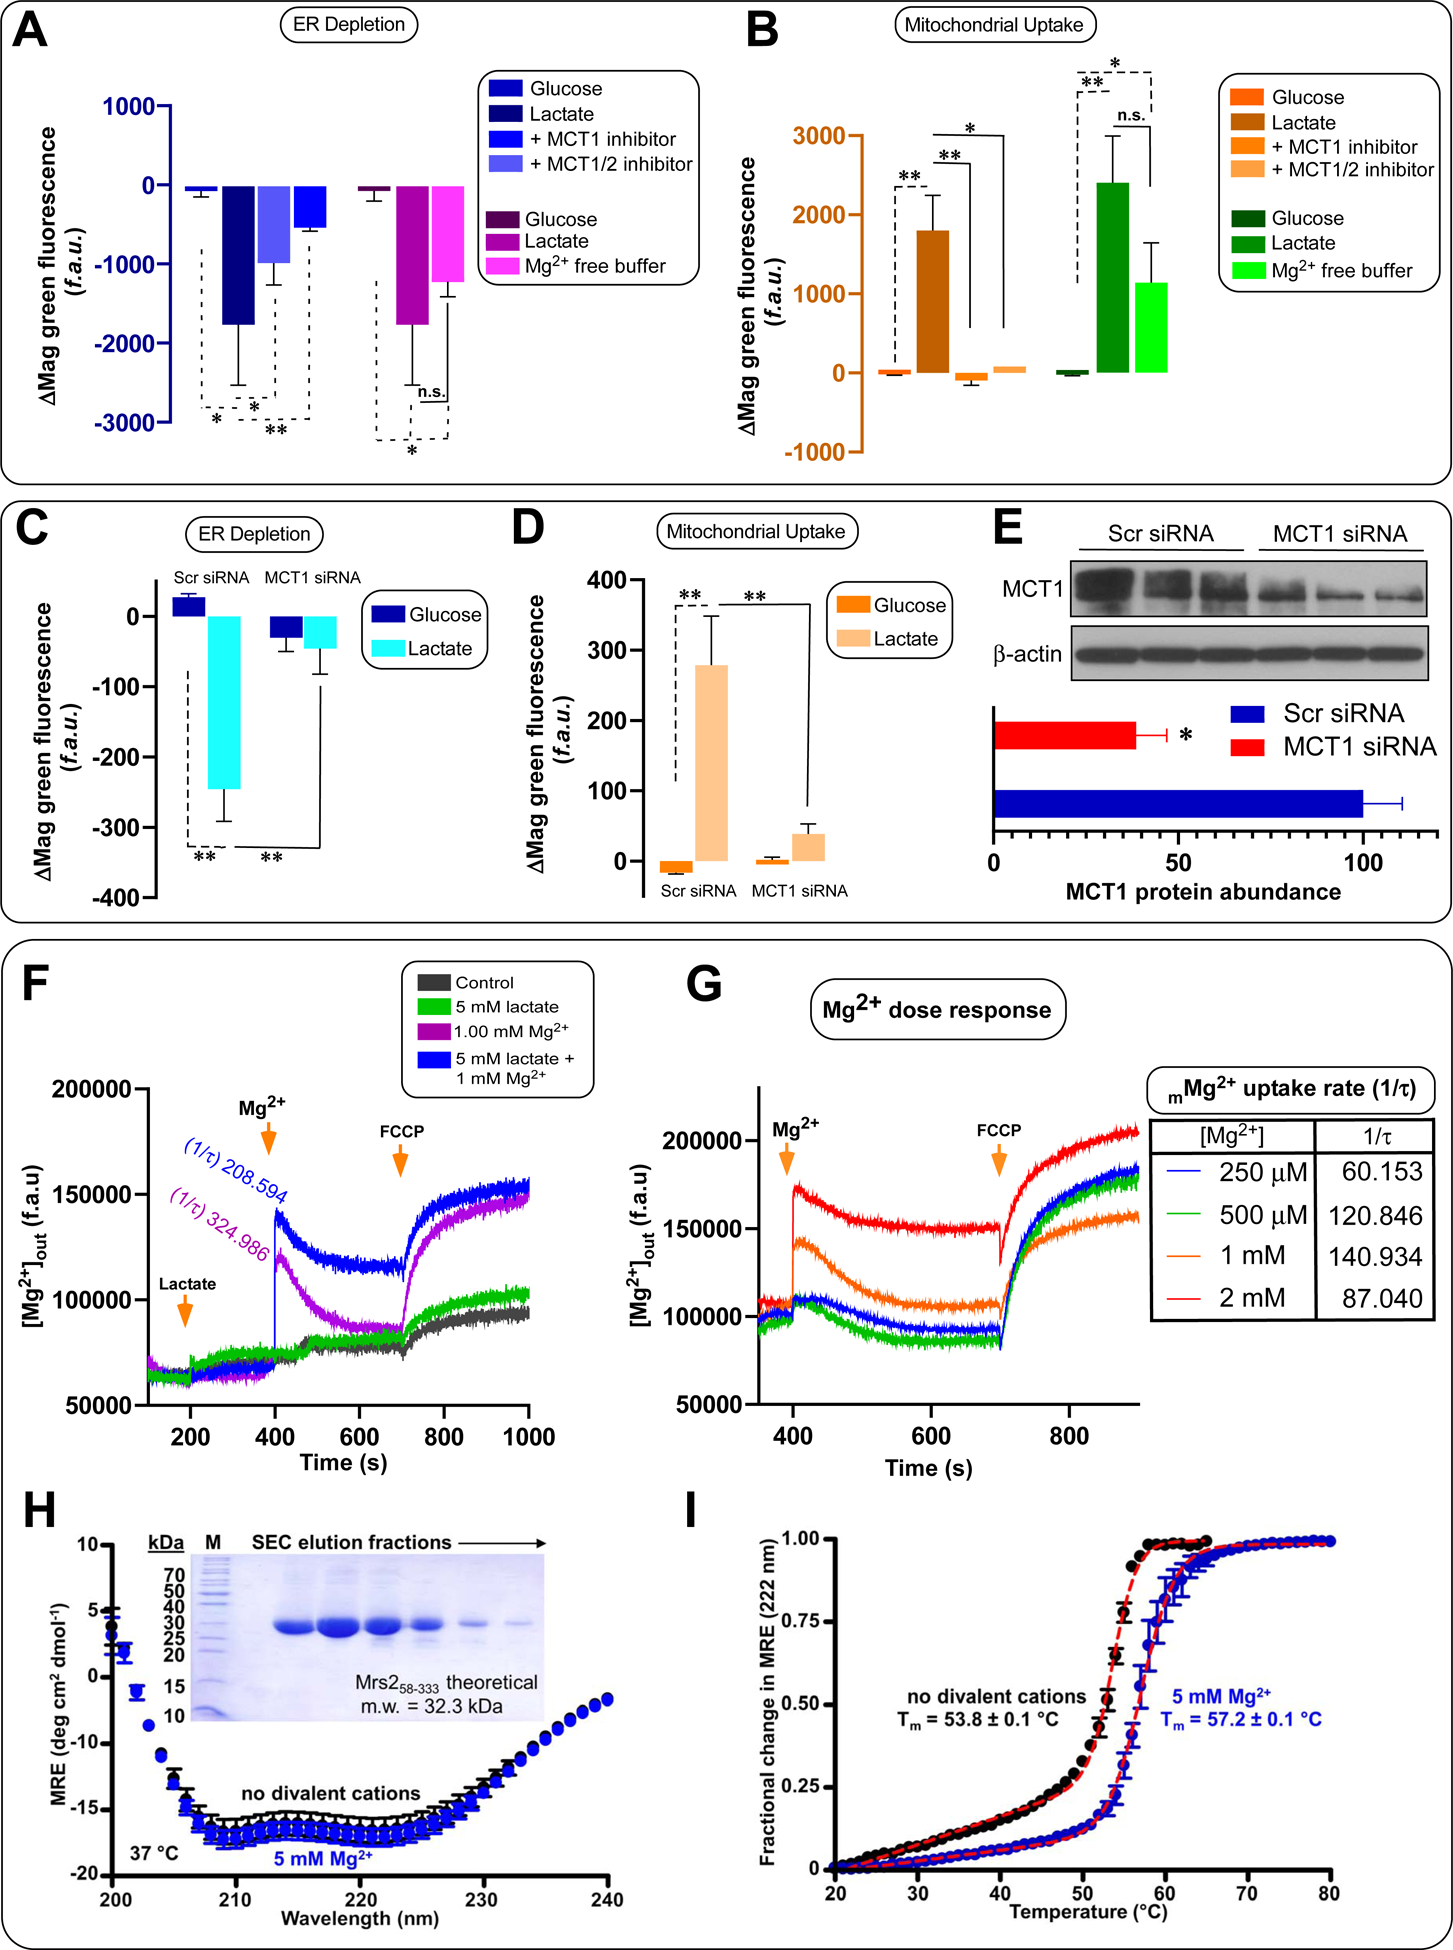
Figure 3. Lactate-dependent Mg2+ flux into mitochondria is primarily from intracellular ER stores.

(A-B) Relative changes in Mag-Green signal within ER or (B) mitochondria after stimulation with glucose and lactate, or lactate after pretreatment with MCT1 (ARC13800; 1 μM) and MCT1/2 (AR-C155858; 2 μM) inhibitors. n=3–6. Mean ± SEM. n=3–9
(C-D) Relative changes in Mag-Green signal within ER or (D) mitochondria in MCT-1 knockdown HepG2 cells. n=3–4. Mean ± SEM.
(E) Western blot showing changes in HepG2 MCT1 protein expression following RNAi-mediated KD of MCT-1. n = 3.
(F) Permeabilized hepatocytes were pulsed with 1 mM MgCl2 or in combination with 5 mM lactate. Representative traces show bath [Mg2+] (f.a.u). Mean ± SEM. n=3.
(G) Change in bath [Mg2+] due to mMg2+ uptake in response to various bath [Mg2+] in permeabilized hepatocytes. Inset table depicts mitochondrial uptake rate. Mean ± SEM. n=3.
(H) Far-UV CD spectra of the human Mrs2 N-terminal domain (residues 58–333) in the presence (blue) and absence (black) of 5 mM Mg2+. MRE, mean residue ellipticity (×0.001). Inset shows the human Mrs2 N-terminal domain purity.
(I) Thermal stability of the human Mrs2 N-terminal domain. Thermal melts are constructed from the change in MRE at 222 nm as function of temperature. Data in panels H and I are Mean ± SEM. n=3.
*p < 0.05, **p < 0.01, n.s. = not significant.
