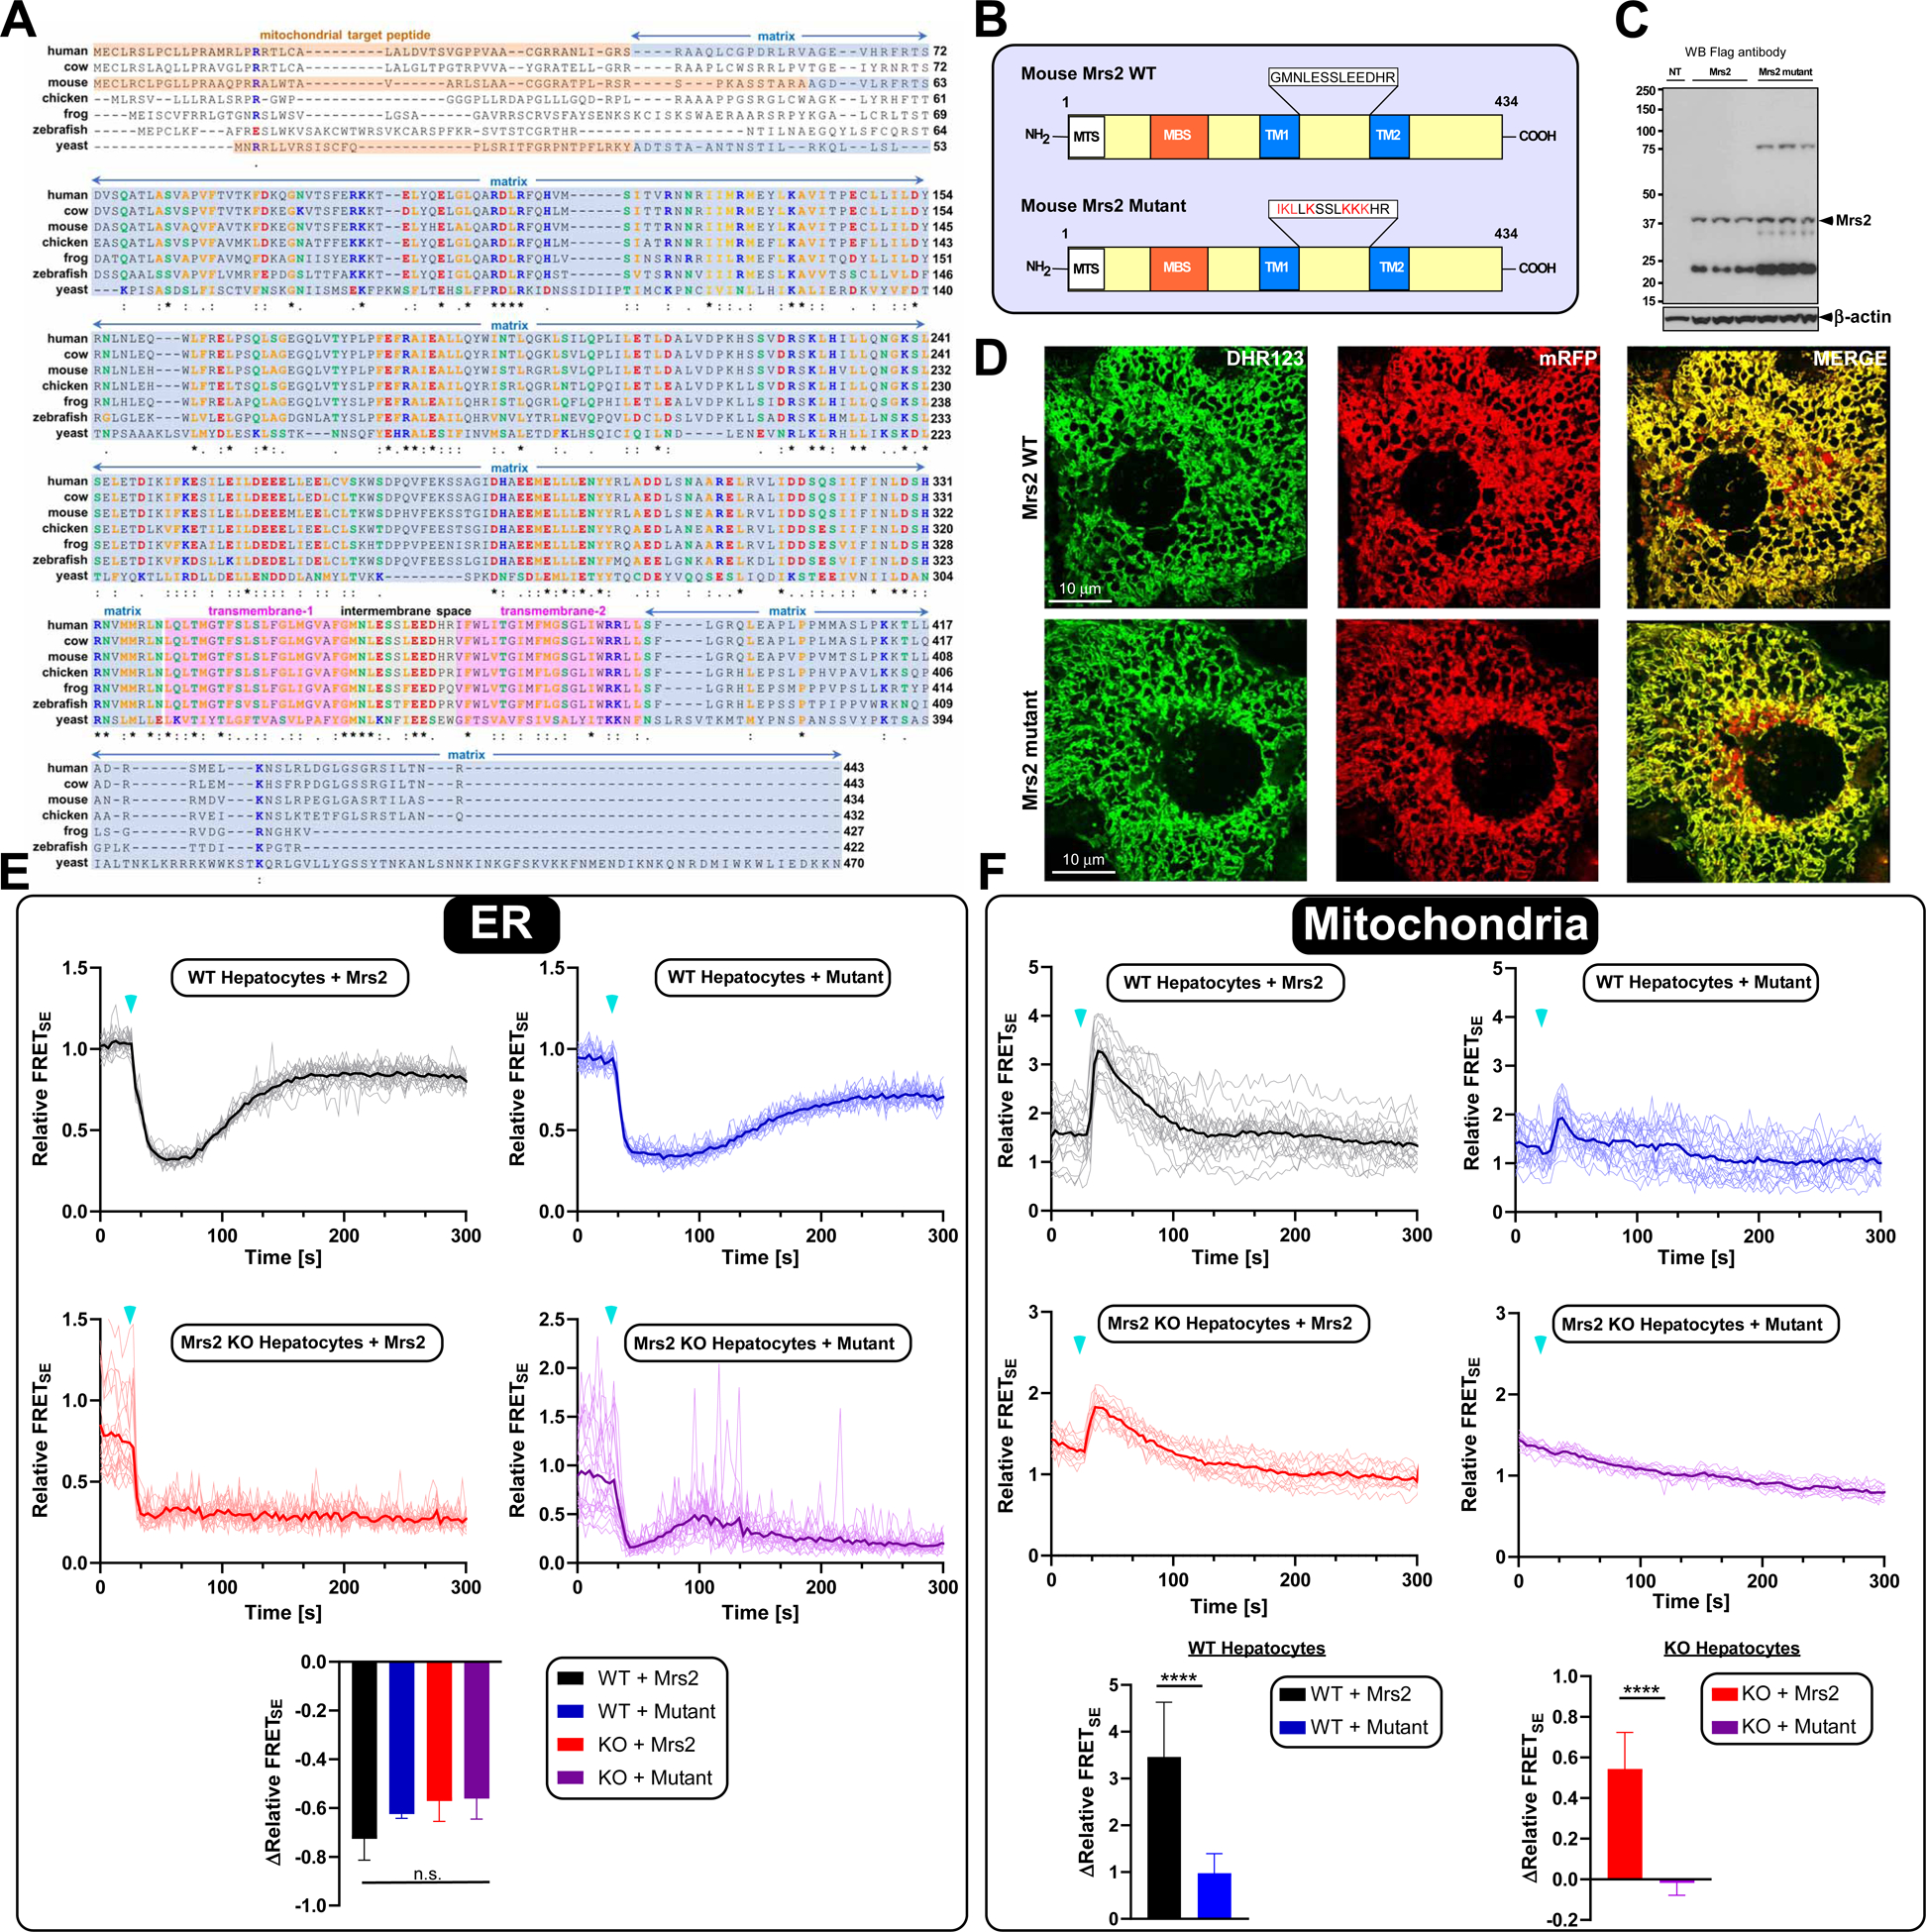
Figure 5. Mutations of the conserved Mrs2 transmembrane loop residues essentially inhibited mMg2+ uptake.

(A) Amino acid sequence alignment of the yeast Mrs2p its only mammalian homologue Mrs2.
(B) The schematic depicts the mouse Mrs2 WT (top) and Mrs2 mutant constructs (bottom).
(C) Western analysis showing the expression of Flag-tagged WT and mutant Mrs2 Adv5 constructs.
(D) Confocal micrographs of primary hepatocytes transduced with WT and mutant Mrs2-tagged with mRFP.
(E-F) Representative traces depicting MagFRET signal changes in the ER (Left) and mitochondria (right) after lactate stimulation. Bar charts show the relative FRETSE. n=4–6. Mean ± SEM. ****p < 0.0001. n.s.= not significant.
