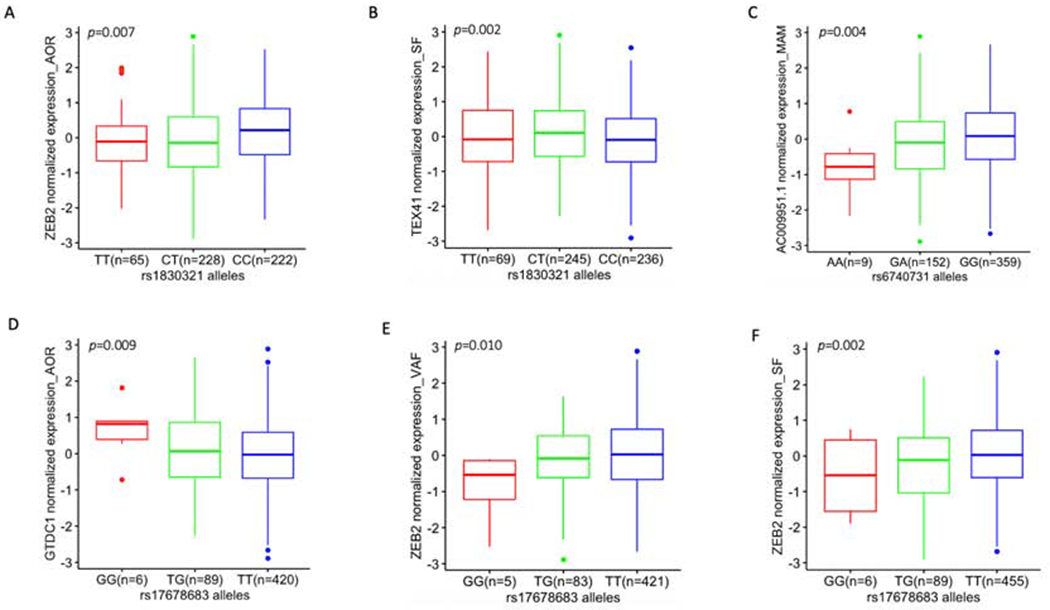
Figure 2.

eQTL box plots of significant associations between genotypes of CAD GWAS SNPs and gene expression in STARNET tissues (see also Table 2).
(A) eQTL at rs1830321 for ZEB2 expression in AOR, (B) eQTL at rs1830321 for TEX41 in SF, (C) eQTL at rs6740731 for AC009951.1 in MAM, (D - F) eQTLs at rs17678683 for GTDC1 in AOR, for ZEB2 in VAF and for ZEB2 in SF, respectively. Homozygous CAD risk alleles are colored red and are on the left of each panel, heterozygous alleles are in green and homozygous reference (CAD protective) alleles are in blue. The number of subjects with 3 different genotypes at rs17678683 vary slightly between tissues because the availability of expression data across these tissues also differs slightly (due to reasons such as isolated samples failing to pass quality checks, or insufficient sample obtained from isolated tissues – see original STARNET manuscript for full details (8)). Although rs6740731 and rs17678683 are in close proximity (Figure 1A), allele frequency of rs6740731 and rs17678683 are different since they are located in different genes and they are not in linkage disequilibrium (Figure 1B).
