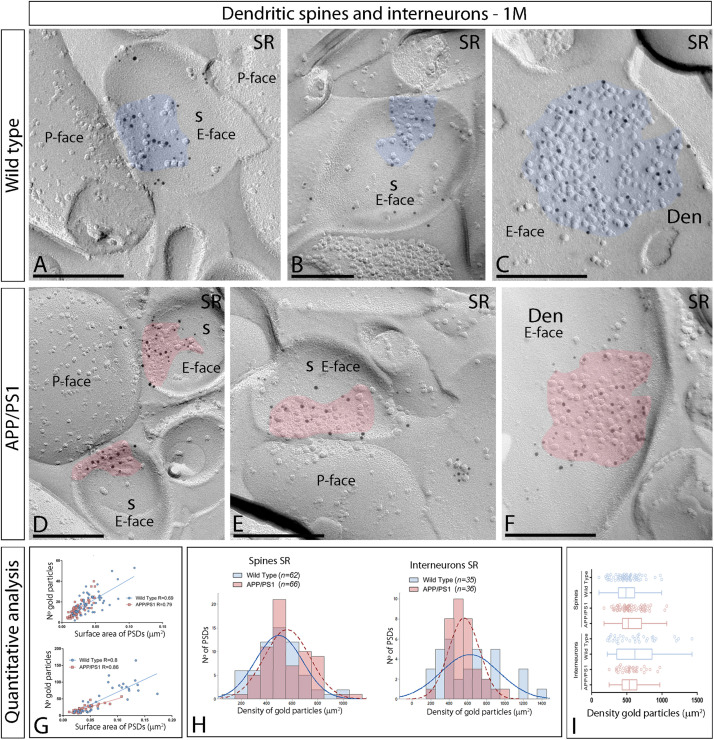
FIGURE 3.
Synaptic AMPARs in dendritic spines and interneurons of APP/PS1 mice at 1 month. (A–F) Electron micrographs of the hippocampus showing immunoparticles for AMPARs at excitatory synaptic sites of dendritic spines of pyramidal cells and shafts of interneurons in the stratum radiatum of the CA1 region, as detected using the SDS-FRL technique. Postsynaptic membrane specializations (IMP clusters, pseudo colored in blue for wild type and in red for APP/PS1 to aid visualization) show strong immunoreactivity for AMPARs (10 nm gold particles), both in the wild type and in the APP/PS1 mice. Scale bars: (A–F), 200 nm. (G) Scatter plots showing the correlation between surface areas of postsynaptic membrane specializations and numbers of gold particles labeling AMPARs in wild type and APP/PS1 mice. (H) Histograms showing the distribution of densities of gold particles that label AMPARs of individual postsynaptic membrane specializations in the stratum radiatum of the hippocampal CA1 region in wild type and APP/PS1 mice. (I) Quantitative analysis showing mean densities of AMPARs in excitatory synapses in spines and interneurons in the stratum radiatum in wild type and APP/PS1 mice. No differences were detected in densities of AMPAR immunoparticles in the spines (WT = 496 ± 23 immunoparticles/μm2; APP = 560 ± 22 immunoparticles/μm2) or interneurons (WT = 626 ± 53 immunoparticles/μm2; APP = 562 ± 29 immunoparticles/μm2) (Two-way ANOVA test and Bonferroni post-hoc test, p > 0.05).

