
Figure 1.
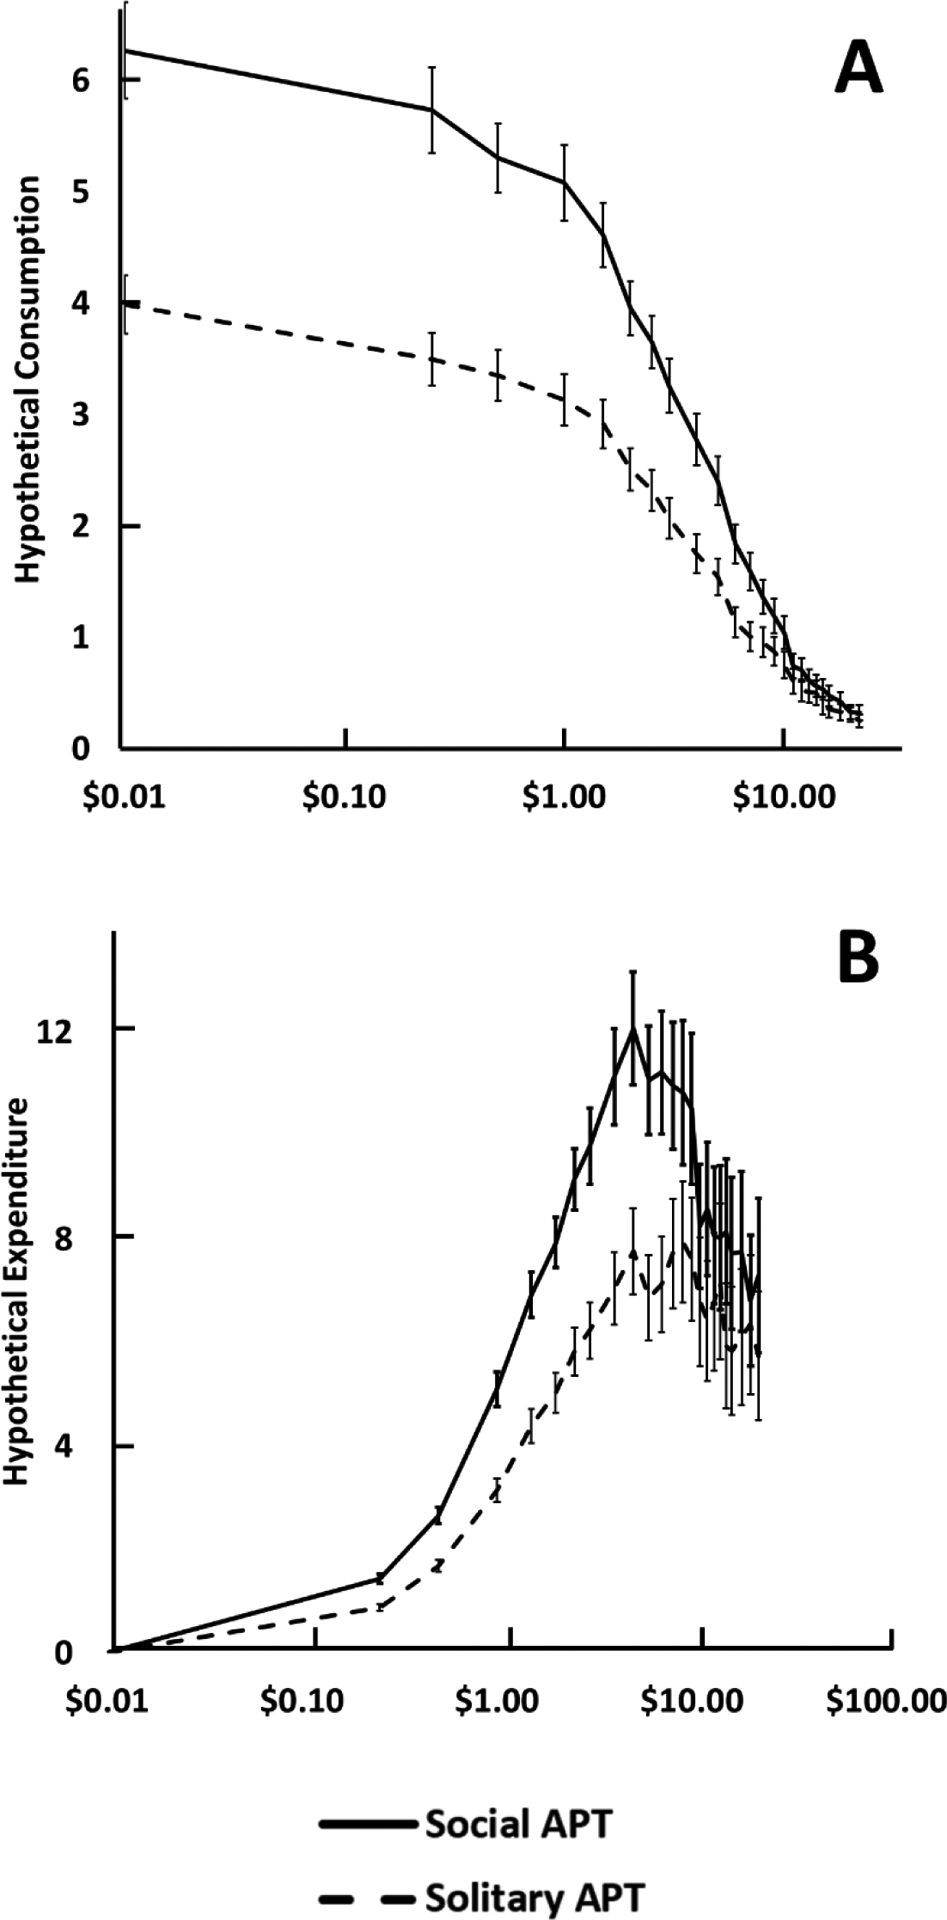
Demand curves for average consumption (Panel A) and expenditure (Panel B) for the Social and Solitary APT conditions. The x-axis is log-transformed. Each data point represents average hypothetical consumption across participants on a particular price of the APT, with error bars reflecting standard error for each price. Consumption and expenditure values were lower in the solitary condition compared to the social condition.