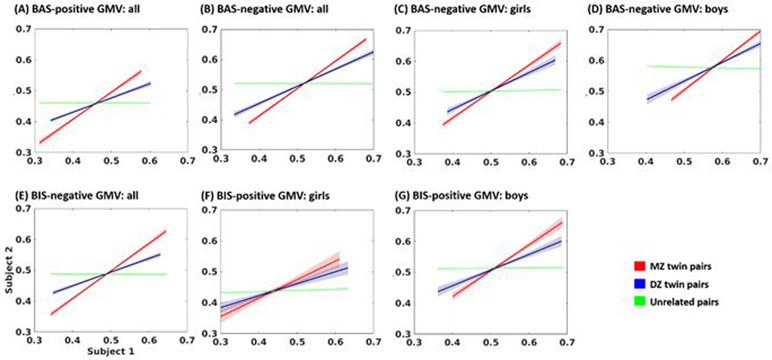
Figure 4.
plots the correlation each of monozygotic twins (MZ), dizygotic twins and siblings (DZ) and unrelated individuals (UR) of (A) BAS residual-positive GMV correlates for all; (B) BAS residual-negative GMV correlates for all; (C) girls’ BAS residual-negative GMV correlates; (D) boys’ BAS residual-negative GMV correlates; and (E) BIS residual-negative GMV correlates for all; (F) girls’ BIS residual-positive GMV correlates; (G) boys’ BIS residual-positive GMV correlates. The results of slope test of these regressions are shown in Supplementary Table S4. Regression lines were built using pairs of average GMVs for MZ and DZ. “Subject 1” and “Subject 2” represent MZ or DZ twin pairs. For UR, pairs of children were randomly constructed by shuffling and splitting the sample into halves. This procedure was repeated 100 times, and mean regression lines were computed. 95% confidence intervals were calculated and are represented in the plot by shaded areas for MZ and DZ.

