
Figure 2. Effects of NSDHL deficiency on pancreatic adenocarcinoma development.
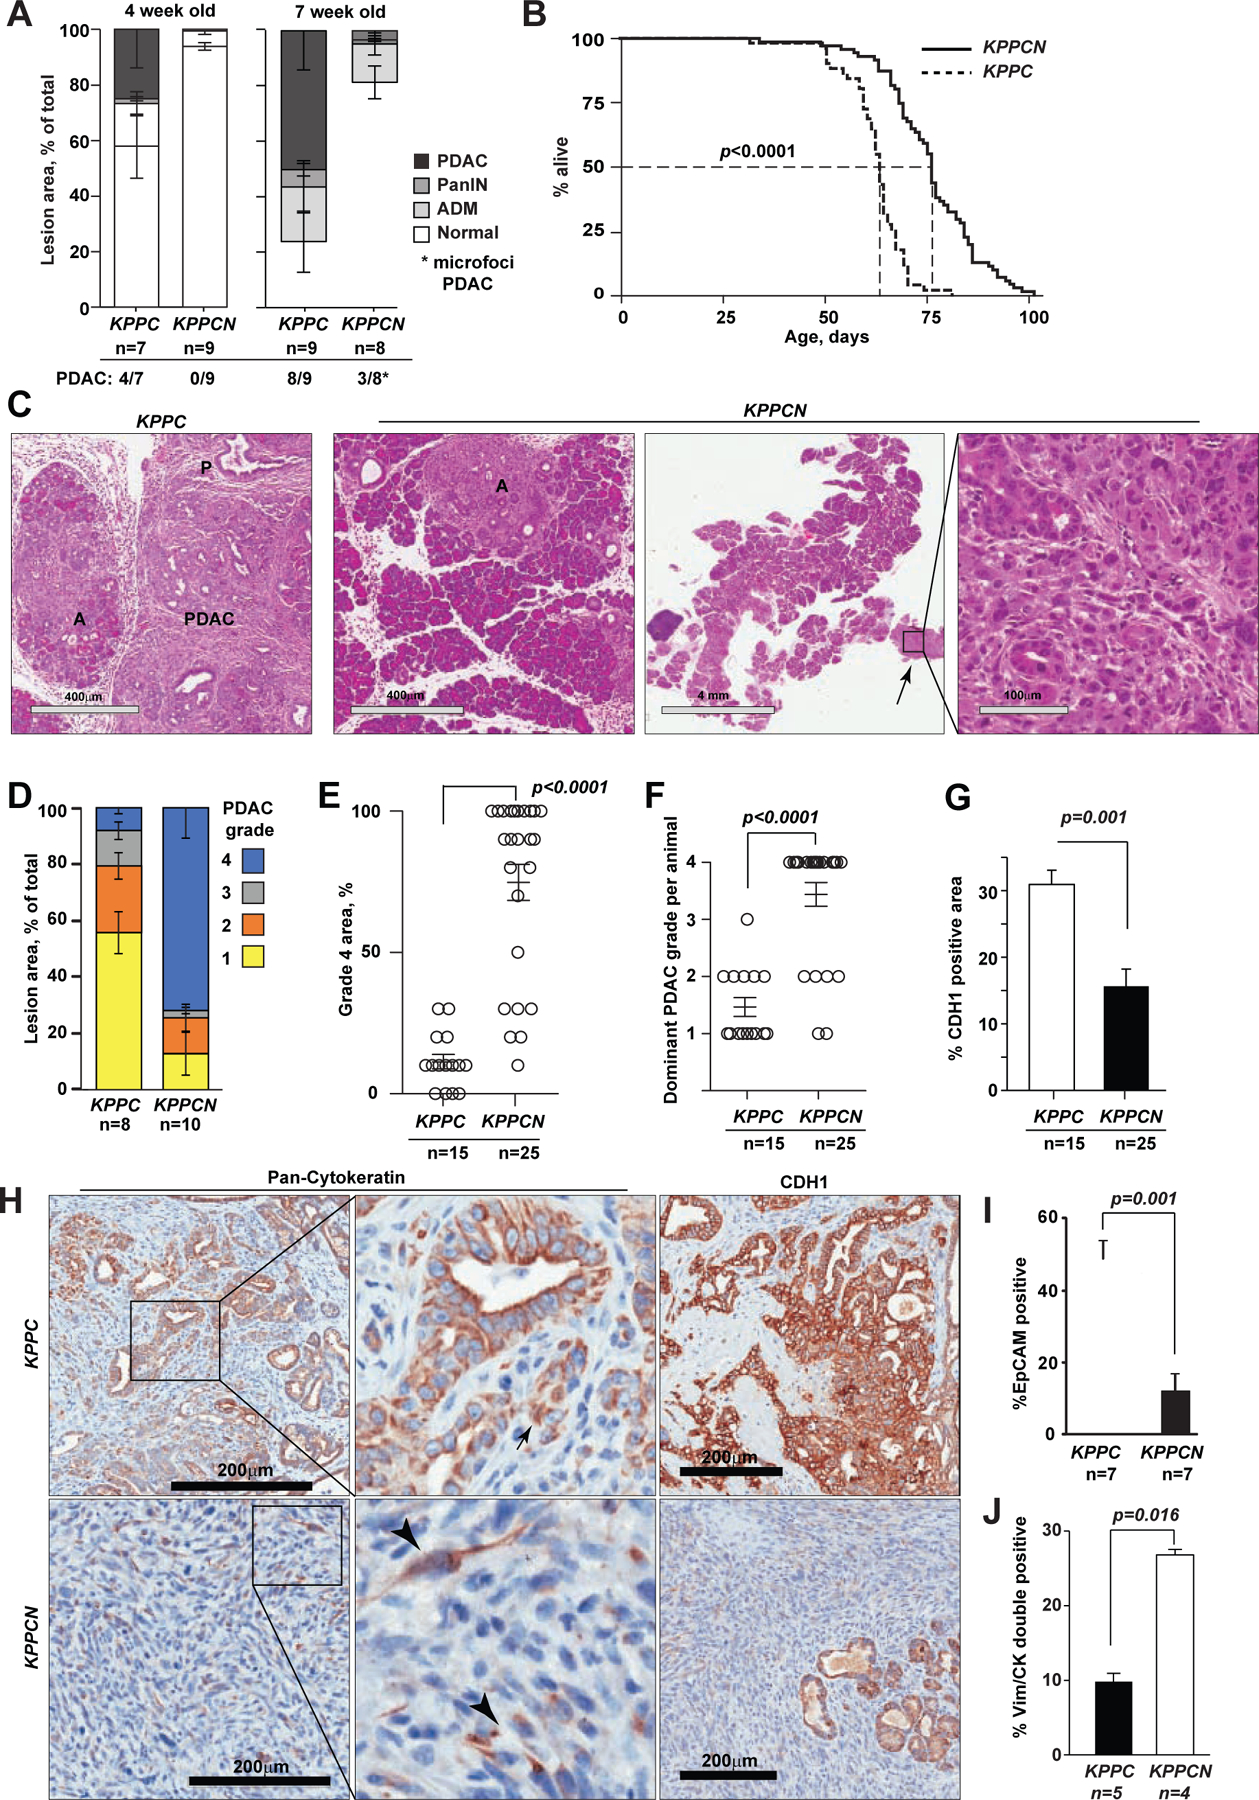
(A) Histological grading of pancreatic epithelial lesion in KPPC and KPPCN mice at 4 and 7 weeks of age; p<0.02 for comparisons of PDAC and normal areas. (B) Kaplan-Meier survival of KPPC (n=64) and KPPCN (n=76) mice; p<0.0001, Logrank test. (C) Hematoxylin and eosin stained pancreas sections of KPPC and KPPCN mice at 7 weeks of age. Small foci of grade 4 PDAC (arrow) are seen on the background of nearly normal KPPCN pancreatic tissue with ADM (A) and early PanIN (P) lesions. Scale bars, as shown. (D) Histological grading of pancreatic adenocarcinoma; p<0.01 for grades 1, 3 and 4. (E) Comparison of per cent of grade 4 PDAC areas; p<0.0001. (F) Histological grades of predominant PDAC per animal; p=0.0009. (G) Quantification of CDH1 expression as percent of positive areas per section; p=0.001. (H) Representative pan-cytokeratin (CK) and E-cadherin (CDH1) staining of pancreatic tumor tissues. Arrows, CK-positive PDAC cells. Scale bars, 200 μm. (I) Percentage of EPCAM-positive epithelial cells assessed by FACS in primary KPPC and KPPCN tumors; p=0.0012. (J) Quantification of CK+/VIM+ double positive cells by simultaneous multi-channel immunofluorescence (see images in Figure S2); p=0.016. In all graphs, data are represented as mean±SEM, p-values by Wilcoxon test. See also Figure S2 and Table S3.