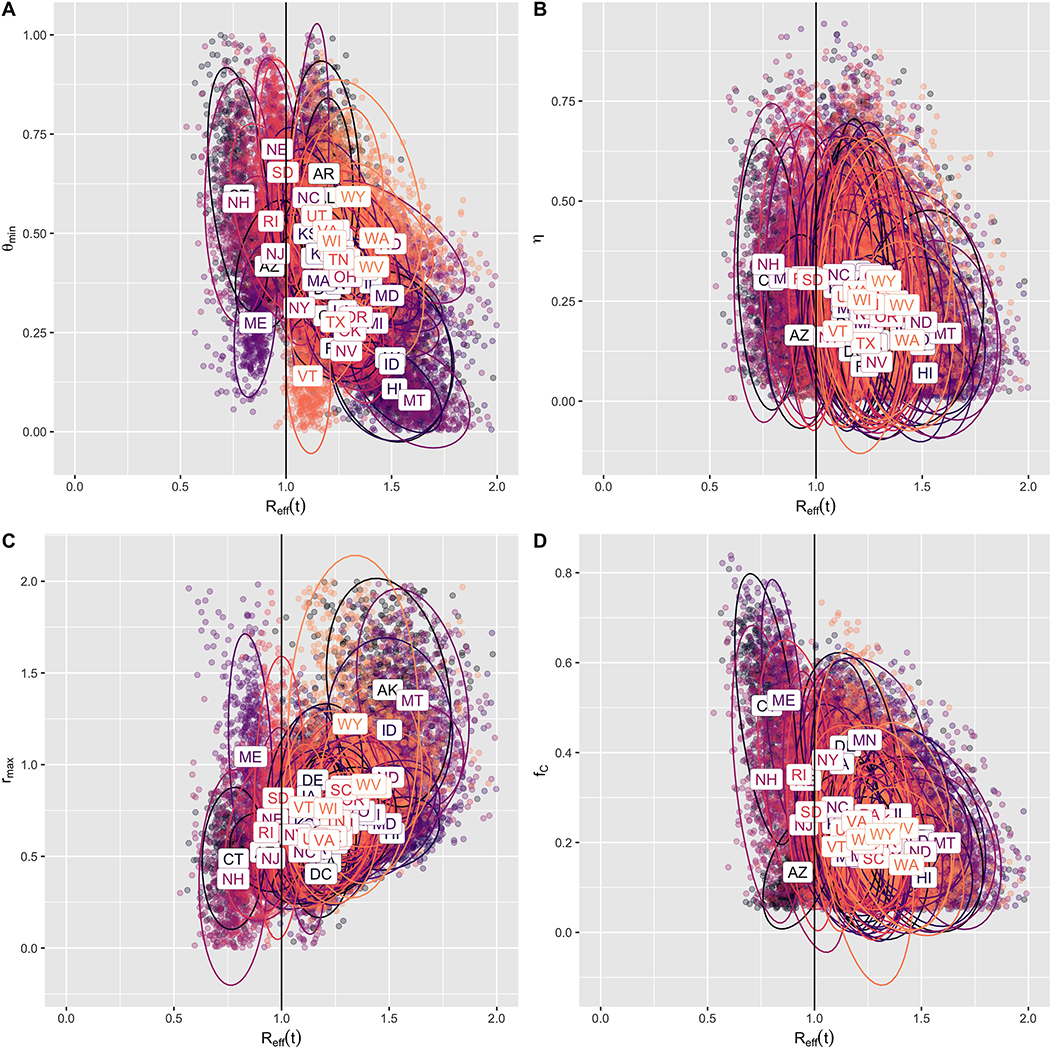
Extended Data Fig. 1: Correlations across states between Reff(t) and (A) θmin, (B) η, (C) Δ, and (D) fC.
For each state, 500 posterior samples are shown. Substantial state-to-state heterogeneity is evident in all parameters, with η,θmin, rmax, and fC contribute over 50% of the variance in Reff(t) under a linear model (estimated from ANOVA table [Table S1] using the sum-of-squares relative to the total sum-of-squares). For θmin, while lower values appear to be associated with greater current values of Reff(t) in a univariate model (linear model coefficient = −0.54, t statistic = −78.14, p < 2.2e-16, 95% CI = [−0.56,−0.53]), the correlation is positive in the multivariate model (coefficient = 0.11, t statistic = 13.65, p < 2.2e-16, 95% CI = [0.09, 0.13]). The other parameters correlate as expected: higher Reff(t) is correlated with lower contribution from hygiene practices (smaller η) (coefficient = −0.39, t statistic = −59.7, p < 2.2e-16, 95% CI = [−0.40,−0.38]), more reopening (larger rmax) (coefficient = 0.44, t statistic = 119.0, p < 2.2e-16, 95% CI = [0.43, 0.45]), and lower rates of contact tracing (smaller fC) (coefficient = −0.90, t statistic = −114.6, p < 2.2e-16, 95% CI = [−0.92, −0.89]).

