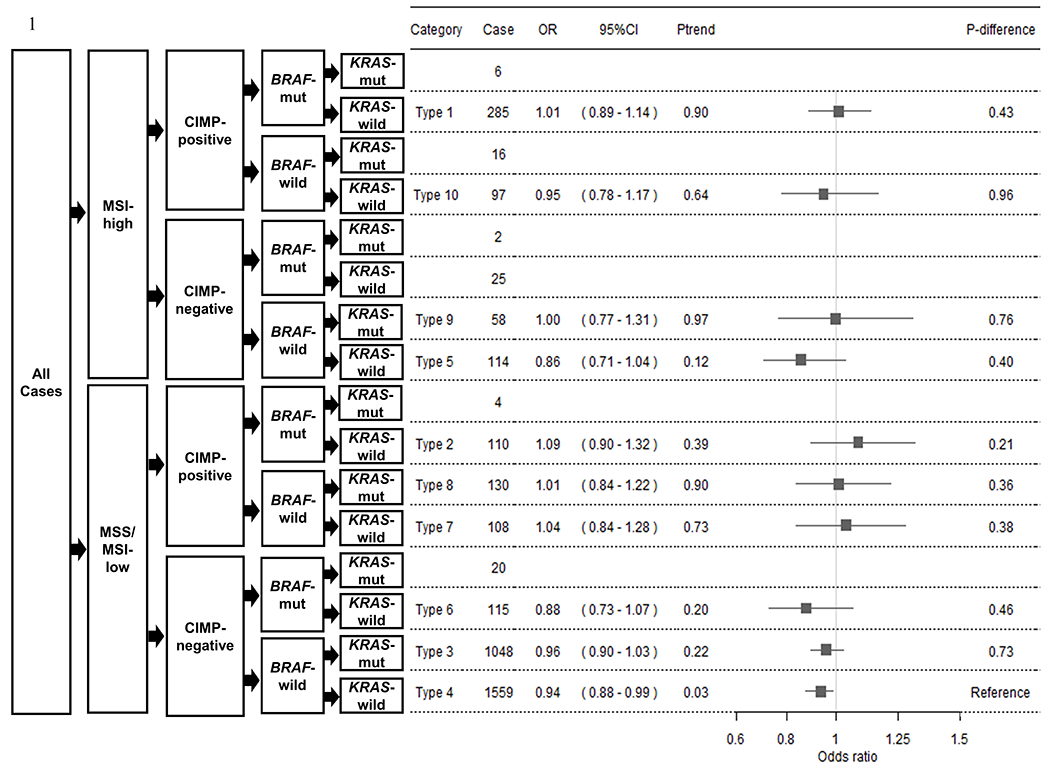
Figure 1. Forest plot of the association between fiber intake and colorectal cancer risk by combined molecular subtypes using polytomous logistic regression analysis.

Odds ratios (ORs) and 95% confidence intervals (95% CIs) for multivariate adjusted models are presented for each increasing quartile of fiber intake and each combined molecular subtypes of colorectal cancer (CRC) risk. A total of 3,697 cases and 6,485 controls were included. Gray boxes are centered at multivariate adjusted ORs, and lines depict their 95% CIs. Subtype classifications with less than 50 cases were excluded from analyses. The number of cases per molecular subtype are listed under Cases. Ptrend was calculated by assigning ordinal values for quartile categories of fiber intake and modeling that variable continuously. P-difference is the degree of difference in P-value of multivariate adjusted OR between Type 4 and each of the other Types.
