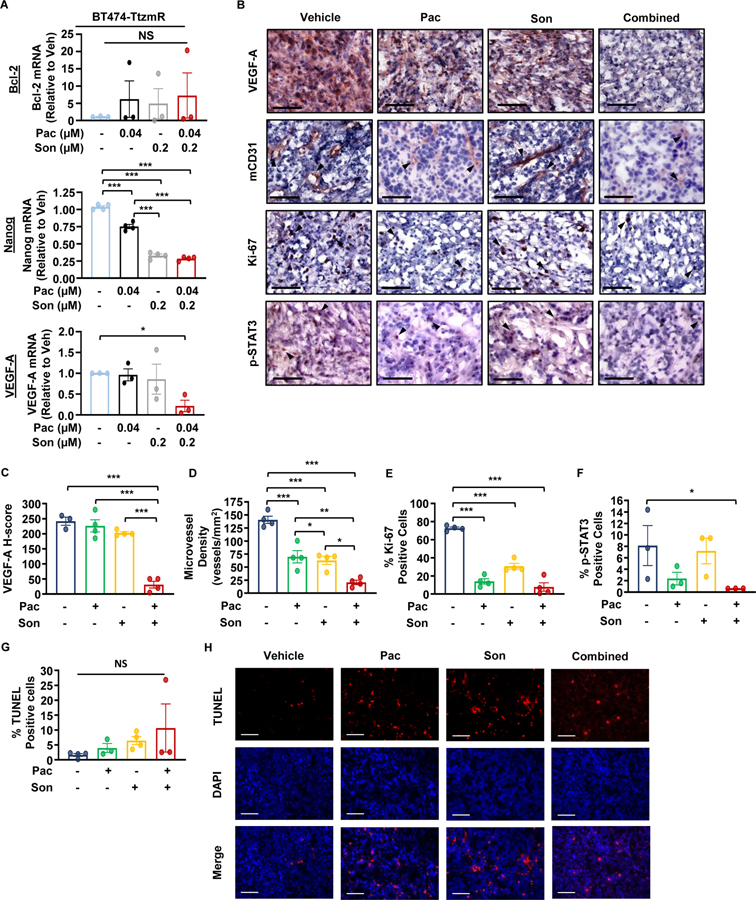
Figure 7: JAK2 and SMO inhibitors synergize to reduce angiogenesis, tumor cell proliferation, and STAT3 activation of HER2-positive, trastuzumab-resistant breast cancer in vivo.
(A) RT-qPCR analysis of JAK2-STAT3 and SMO-GLI1/tGLI1 target genes following treatment of BT474-TtzmR cells in vitro. (B) Representative IHC images of VEGF-A, mCD31, Ki-67, and p-STAT3 (Y705) of treated BT474-TtzmR mammary fat pad xenografts. Images were taken under 20X magnification. Arrows point to examples of positive staining. (C–E) Quantification of histologic staining of VEGF-A (C), mCD31 (microvessel density; (D), % Ki-67 positivity (E), and % p-STAT3 (Y705) positivity (F) of treated BT474-TtzmR MFP xenografts. (G) Quantification of the number of TUNEL positive cells of mammary fat pad xenografts from each treatment group. (H) Representative images of TUNEL-positive staining of mammary fat pad xenografts from each treatment group. TUNEL, DAPI, and TUNEL-DAPI merged. Images were taken under 10X magnification. For all analyses, at least 5 fields were quantified per tumor section (N=4–5 tumors/group). All scale bars represent 100 μm. Pac, pacritinib. Son, sonidegib. Data presented as mean ± SEM. One-way ANOVA with Tukey’s multiple comparison post hoc test was used to compute p values. *, p < 0.05; **, p < 0.01; ***, p < 0.001.

