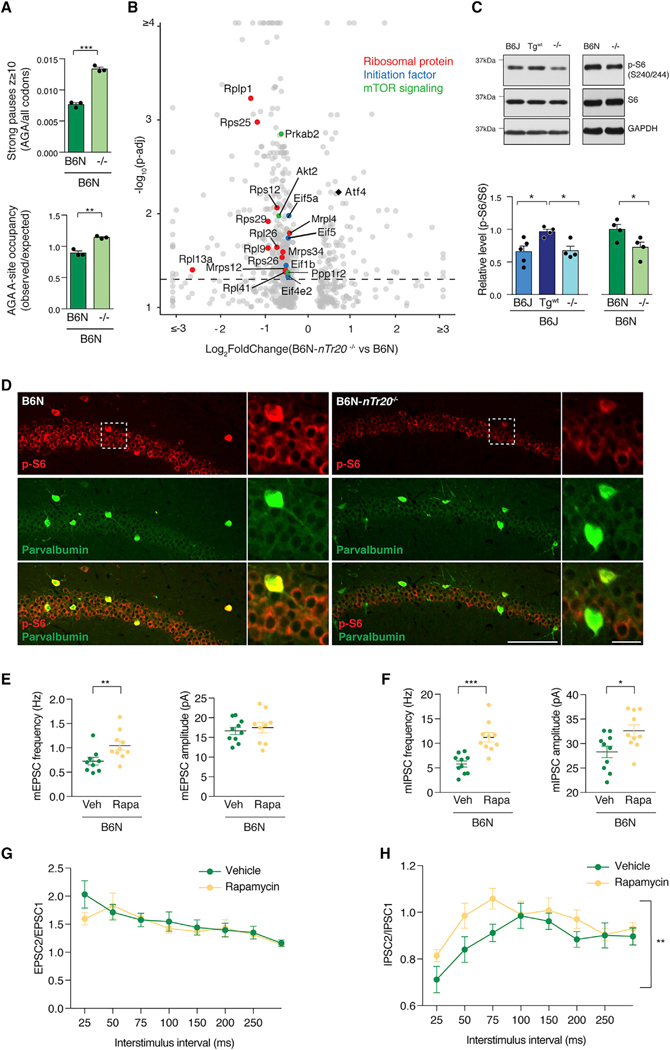
Figure 5. Loss of n-Tr20 Alters mRNA Translation and Suppresses mTOR Signaling.
(A) Ribosome profiling of hippocampal translation upon deletion of n-Tr20. Fraction of genome-wide pauses (z ≥ 10) at AGA codons (top). Average occupancy at AGA codons (bottom).
(B) Analysis of differential translation efficiency upon deletion of n-Tr20. p-adj = 0.05; dashed line.
(C) Western blot of S6 ribosomal protein phosphorylation in the hippocampus upon mutation of n-Tr20. The level of p-S6 is shown relative to either B6J-Tgwt mice or B6N mice. Data are represented as mean + SEM.
(D) p-S6 (S240/244) and parvalbumin immunofluorescence in the CA1 region of the hippocampus. Scale bars represent 100 μm (20 μm, higher magnification).
(E–H) Synaptic properties of mice treated with either vehicle (Veh) or the mTOR inhibitor rapamycin (Rapa). Mean frequency and amplitude of mEPSCs (E) and mIPSCs (F). Paired-pulse response of evoked EPSCs (G) (rapamycin, n = 9 cells; vehicle, n = 10 cells) and IPSCs (H) (n = 11 cells for both). Data are represented as mean ± SEM.
***p ≤ 0.001, **p ≤ 0.01, and *p ≤ 0.05. See also Figures S6–S8.

