
Figure 6: Clinical course for patients in the DIREct Discovery and Validation Cohorts.
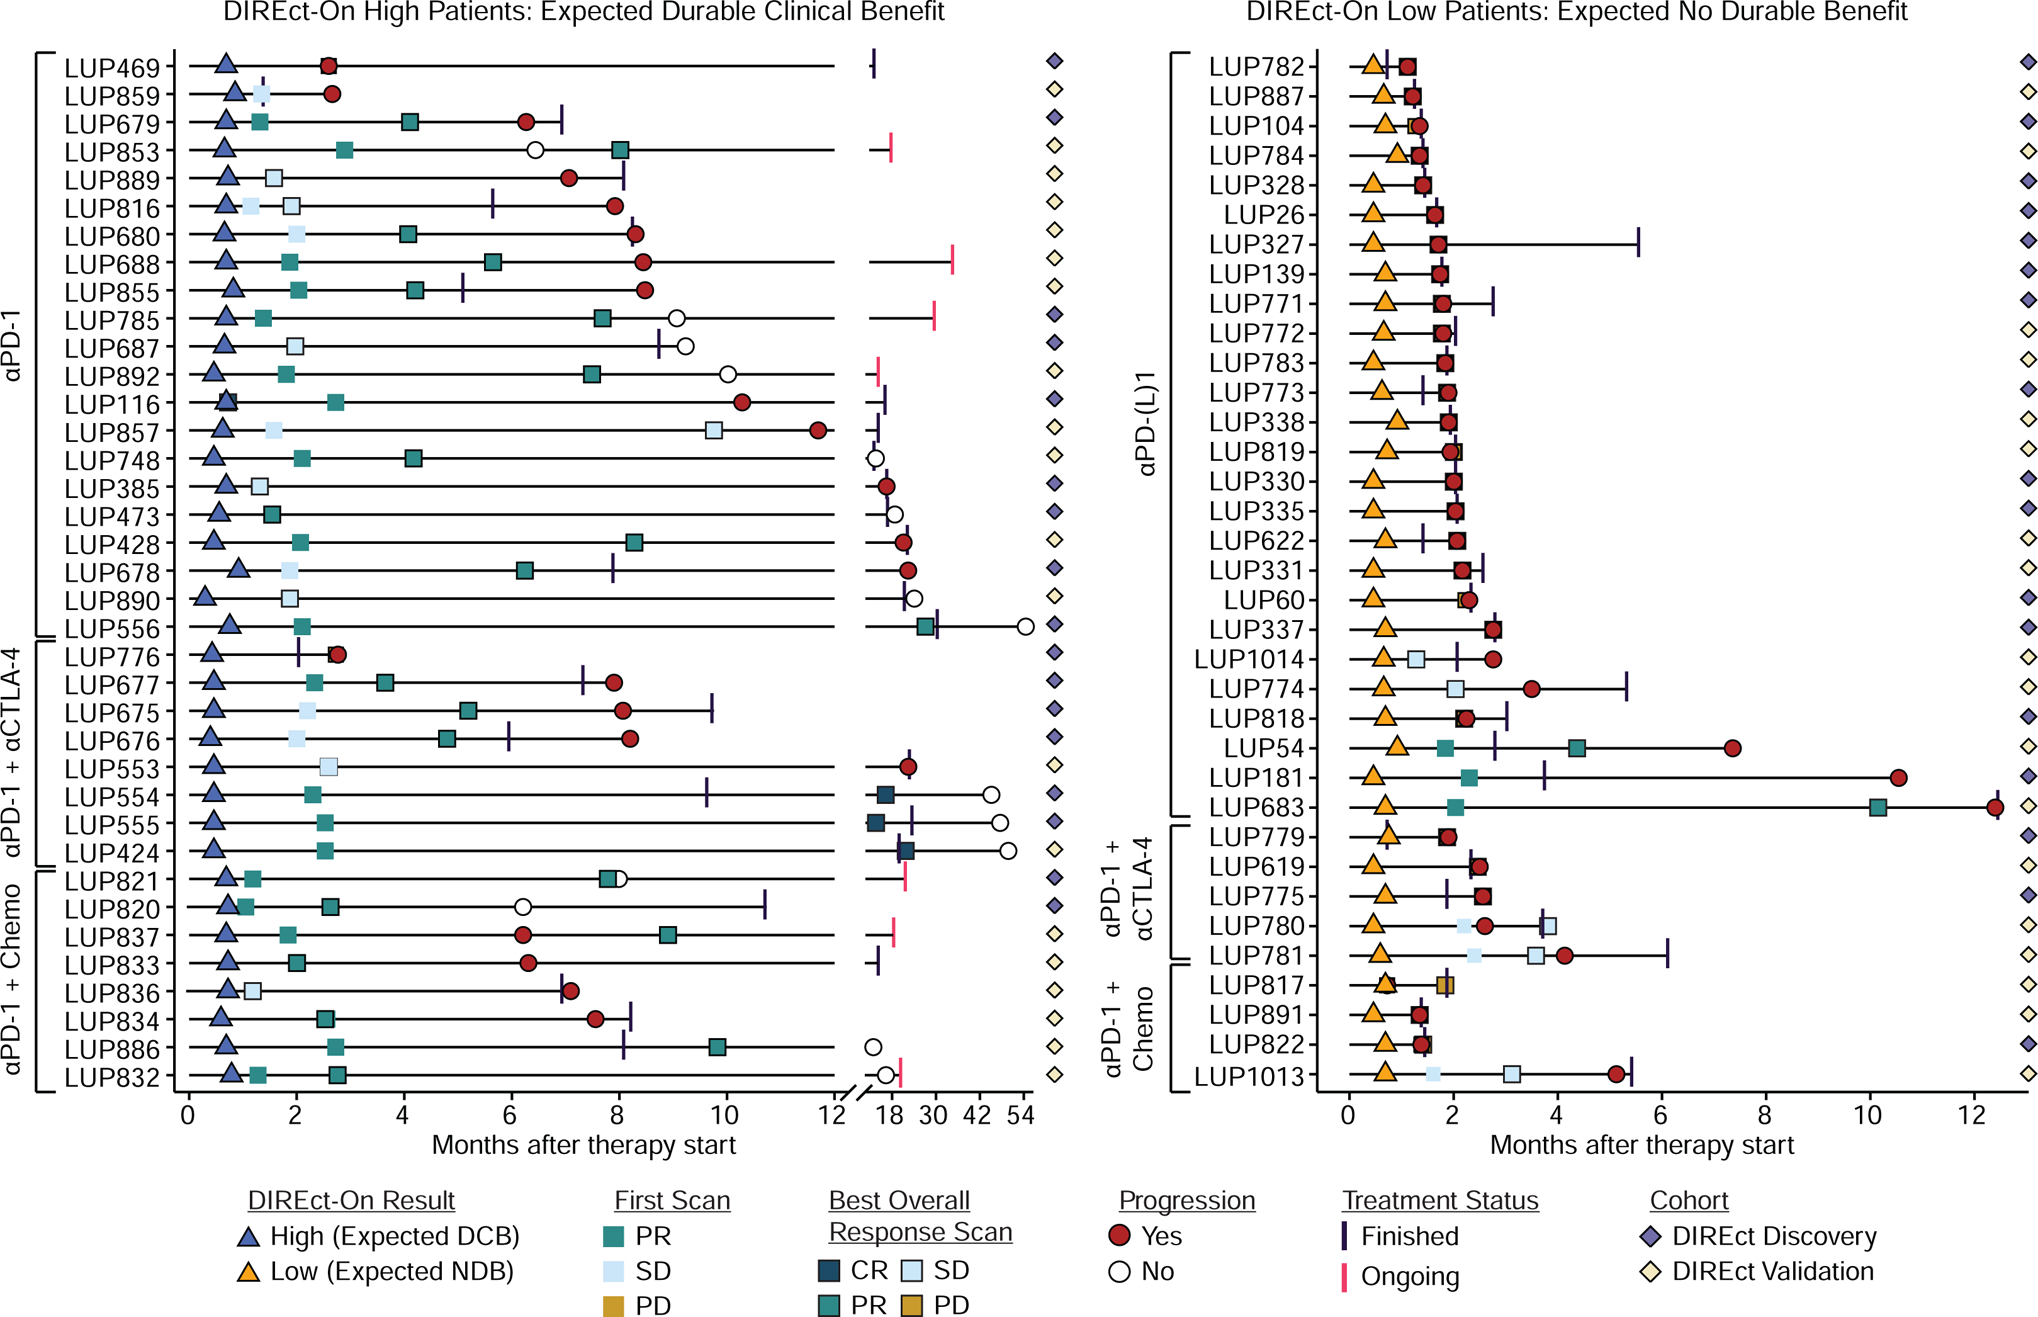
Swimmers chart for patients with high (left) or low (right) DIREct-on scores. Chart depicts timing of on-treatment blood draw for DIREct-On results (triangles), RECIST v1.1 status at the first scan (squares without outline) and the scan demonstrating the best overall response (squares with outline). In cases where the first scan was also the best overall response scan only the first scan is shown. Progression events or time of censoring is shown (red circle = progression, open circle = no progression at last follow-up). Last infusion date is depicted as a vertical line (black = treatment finished, pink = treatment ongoing). Patients belonging to the DIREct Discovery (purple) or Validation Cohort (tan) are indicated by diamonds. See also Figure S6.