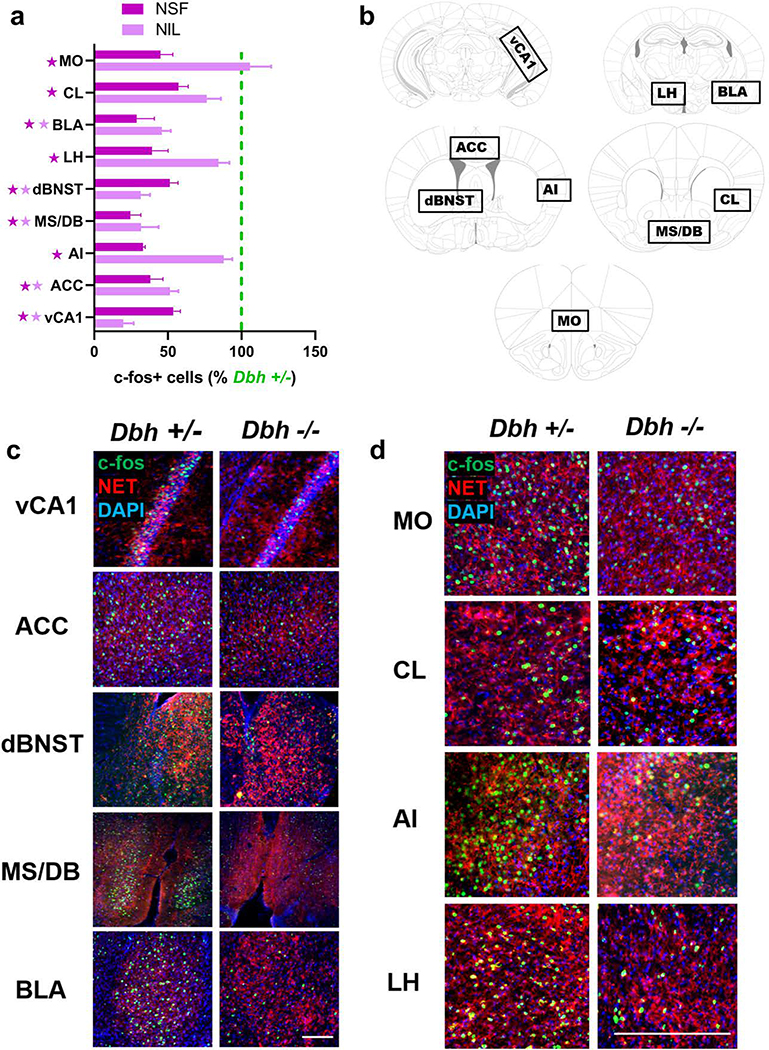
Fig. 6.
Visualization of NET+ noradrenergic fibers and c-fos induction in target regions after novelty-suppressed feeding (NSF). a c-fos induction in Dbh −/− mice in the LC and forebrain targets after NSF (darker purple) and NIL (lighter purple), expressed as a percentage of the average number of c-fos+ cells in Dbh +/− controls for each behavioral test and region. Dark purple stars indicate p < 0.05 for NSF, light purple stars indicate p < 0.05 for NIL. b Anatomical location of brain regions that were hypoactive in Dbh −/− mice after either NSF or NIL, including ventral hippocampus subfield CA1 (vCA1), anterior cingulate cortex (ACC), dorsal bed nucleus of the stria terminalis (dBNST), medial septum/diagonal band (MS/DB), basolateral amygdala (BLA), medial orbitofrontal cortex (MO), claustrum (CL), agranular insula (AI), and lateral hypothalamus (LH). c Representative micrographs showing immunostaining for NET (red) and c-fos (green) between Dbh genotypes after NSF. Nuclei are counterstained with DAPI (blue). Following either NSF or NIL, Dbh −/− mice showed fewer c-fos+ cells than controls in vCA1, ACC, dBNST, MS/DB, and BLA. d Following the NSF test, but not following NIL, Dbh −/− mice showed fewer c-fos+ cells than controls in MO, CL, AI, and LH. Error bars denote group mean ± SEM. The scale bar denotes 100 μM in all micrographs.

