
Fig. 4.
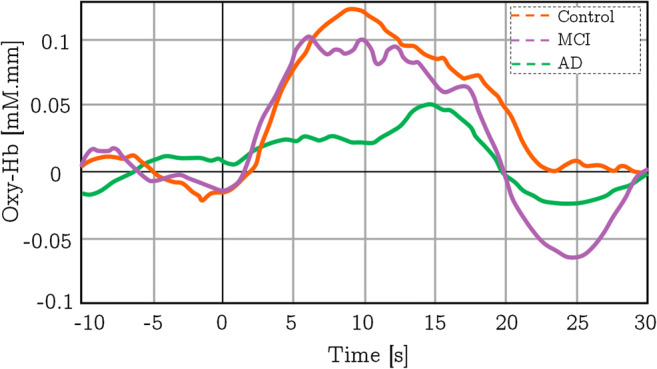
The overall average changes in the concentration of HbO2 of different groups during the verbal fluency test in the right parietal area of the brain. This figure is redrawn from the information found in [37]
Official websites use .gov
A
.gov website belongs to an official
government organization in the United States.
Secure .gov websites use HTTPS
A lock (
) or https:// means you've safely
connected to the .gov website. Share sensitive
information only on official, secure websites.
The overall average changes in the concentration of HbO2 of different groups during the verbal fluency test in the right parietal area of the brain. This figure is redrawn from the information found in [37]