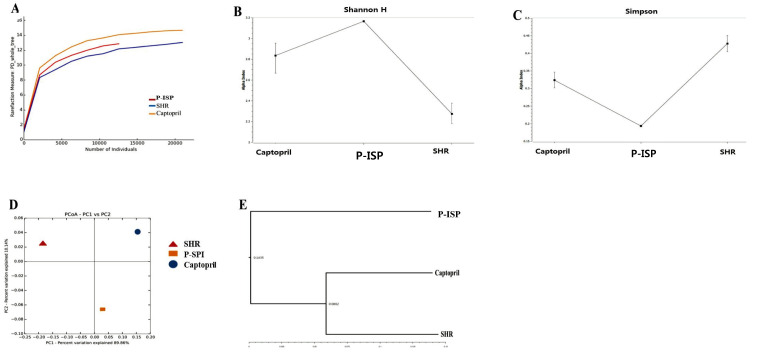
Fig. 3.
Changes in the gut microbiota of rats before and after Captopril or P-SPI treatment. (A) Rarefaction curves for phylogenetic dispersion (ΔPD), (B) Shannon index, (C) Simpson index, (D) weighted UniFrac 2D PCoA plots illustrating the distance between faecal microbial communities from the P-SPI, Captopril and spontaneous hypertensive rat groups and (E) cluster analysis of Bray-Curtis similarity indices of gut microbiota of the three rat groups.

