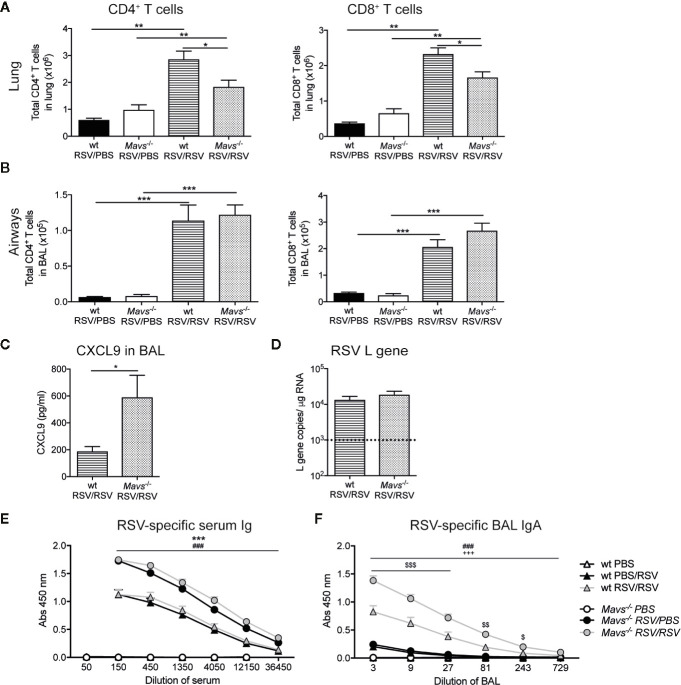
Figure 4.
Reduced T cell numbers in the lung of Mavs−/− mice after re-infection with RSV. Wt and Mavs−/− mice were re-infected with RSV (RSV/RSV) or mock-infected (RSV/PBS) 21 days after primary RSV infection. Four days after secondary infection mice were sacrificed. Total number of CD4+ and CD8+ T cells in the (A) lung and (B) airways of wt and Mavs−/− mice were determined by flow cytometry. (C) Levels of CXCL9 in the BAL fluid of re-challenged mice were determined by Luminex analysis. (D) Gene expression analysis of RSV L gene in lung tissue was determined by quantitative PCR, on day 4 post RSV re-infection. Dotted line represents the detection limit. (E) RSV-specific serum Ig and (F) BAL IgA were determined by ELISA. (A–C) Data are represented as mean ± SEM and pooled from two independent experiments, n = 5–10. (D–F) Data are represented as mean ± SEM and pooled from three independent experiments with up to five mice per group (PBS n = 7–8 and RSV n = 14–15). Statistical significances of differences between groups were determined by (A, B) one-way ANOVA with Tukey’s post hoc test or (C, D) unpaired Student’s t test. (E, F) Statistical significance of differences between groups at defined dilutions was determined by one-way ANOVA with Turkey’s post hoc test. “#” represents statistical significance between wt RSV/RSV and Mavs−/− RSV/RSV mice, “*” represents statistical significance between wt RSV/PBS with Mavs−/− RSV/PBS mice, “$” represents statistical significance between wt RSV/RSV and wt RSV/PBS, “+” represents statistical significance between Mavs−/− RSV/RSV and Mavs−/− RSV/PBS mice. One symbol p ≤ 0.05; two symbols p ≤ 0.01, three symbols p ≤ 0.001.

