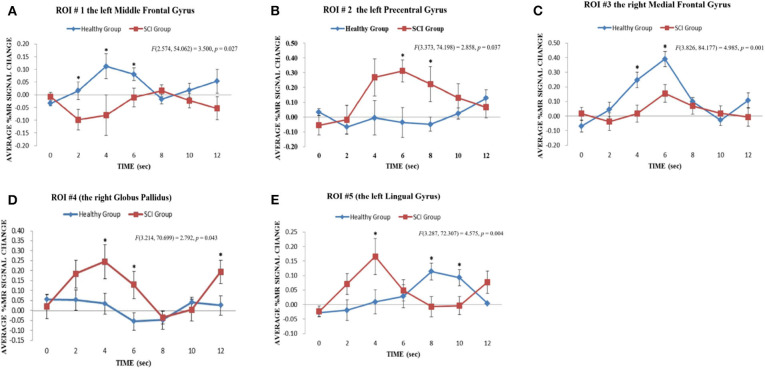
Figure 4.
Results of regional time course analyses for ROIs. The regional time course analyses for ROI #1, ROI #2, and ROI #3 revealed the significant interaction effect between Group x Time on the average % MR signal changes elicited in the upper limb motor imagery task across time points 0–12 s in the contrast of the HC group vs. the SCI group: (A) ROI #1, the left middle frontal gyrus [F(2.574, 54.062) = 3.500, p = 0.027]; (B) ROI #2, the left precentral gyrus [F(3.373, 74.198) = 2.858, p = 0.037] and (C) ROI #3, the right medial frontal gyrus [F(3.826, 84.177) = 4.985, p = 0.001]. *p < 0.05. The regional time course analyses for ROI #4 and ROI #5 revealed significant interaction effects between Group x Time on the average % MR signal changes elicited in the lower limb motor imagery task across time points 0–12 s in the contrast of the SCI group vs. the HC group: (D) ROI #4, right globus pallidus [F(3.214, 70.699) = 2.792, p = 0.043]; (E) ROI #5, left lingual gyrus [F(3.287, 72.307) = 4.575, p = 0.004]. *p < 0.05.

