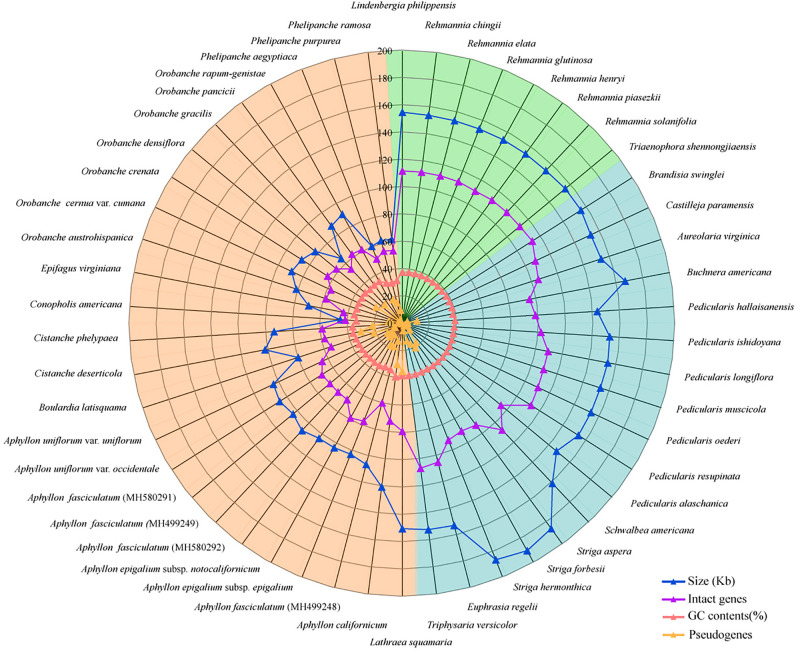
FIGURE 1.
A radar-plot for comparing features of the complete chloroplast genomes in 50 Orobanchaceae species. From inside to outside: pseudogenes, GC contents, number of protein-coding genes, and genome sizes. The background colors of green, blue, and orange represent autotrophic, hemiparasitic, and holoparasitic species, respectively.

