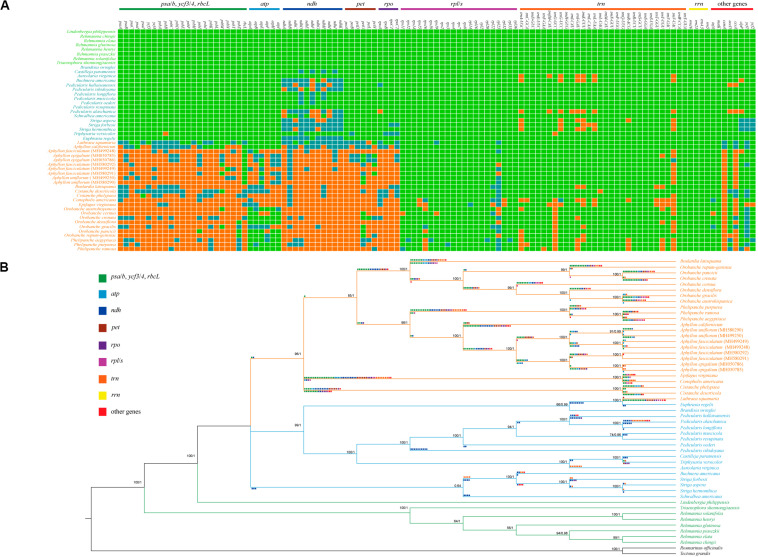
FIGURE 2.
Relationships between gene contents and phylogenetic tree of Orobanchaceae plastomes. (A) Heat map of the presence or absence of chloroplast genes in autotrophs (species names in green), hemiparasites (species names in blue), and holoparasites (species names in orange). Green blocks, presence of a gene; blue, presence of a pseudogene; orange, absence of the gene from the chloroplast genome. (B) Inferred gene losses in the phylogenetic tree of Orobanchaceae reconstructed using ML and BI methods. Pseudogenization is illustrated below the branches, whereas gene deletion is shown above the branches.

