Figure 8.
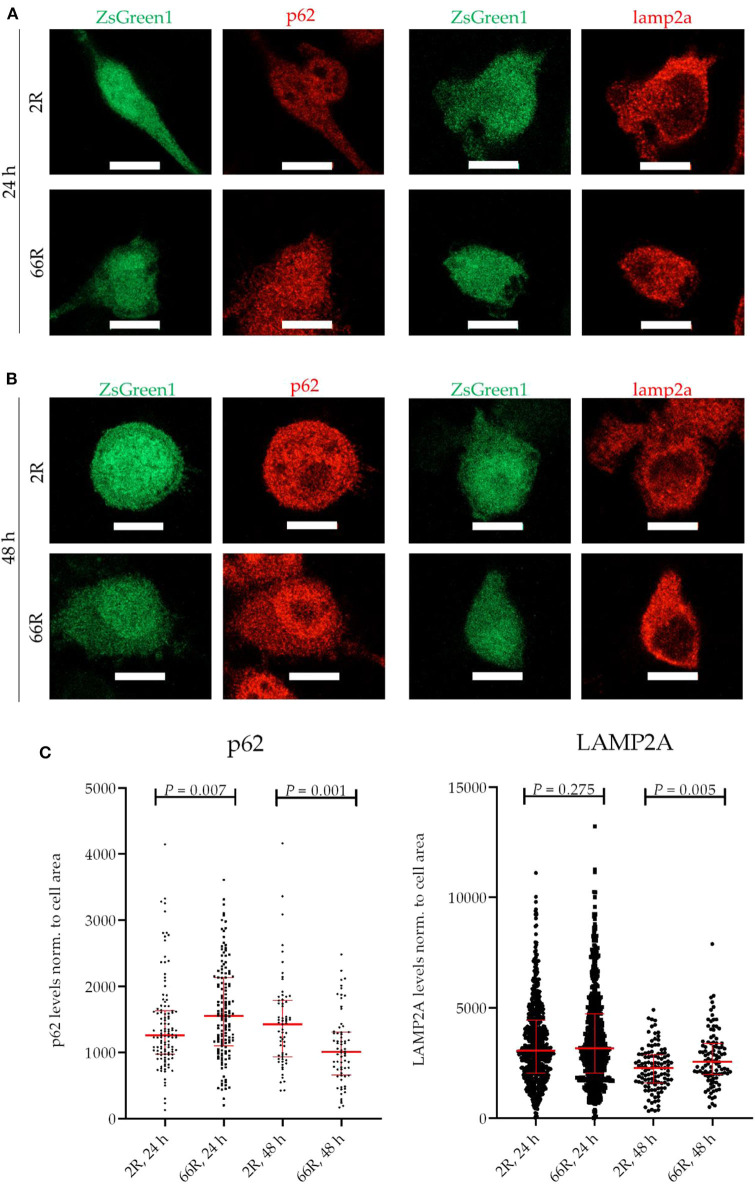
BV-2 cells expressing the C9orf72 hexanucleotide repeat expansion show altered levels of p62 and LAMP2A. Representative microscopy images (A,B) and corresponding quantifications (C) from two (p62) and three (LAMP2A) independent cell culture experiments. P62 and LAMP2A (red) levels were quantified on the basis of Alexa Fluor 568 intensity (secondary antibody) using fluorescence microscopy. Data were normalized to cell area. BV-2 cells were harvested 24 h (A,C) or 48 h (B,C) after transfection with either 2R or 66R plasmids in combination with a plasmid coding for ZsGreen1. Only ZsGreen1 (green) positive cells were analyzed. Scale bar = 10 μm. Data are shown as median ± interquartile range. Mann–Whitney U-test was performed; for p62: n = 115/144 (2R/66R; 24 h), n = 63/68 (2R/66R; 48 h); for LAMP2A: n = 636/585 (2R/66R; 24 h), n = 113/102 (2R/66R; 48 h). LAMP2A, lysosome-associated membrane protein 2 a; ZsGreen1, Zoanthus sp. green fluorescent protein.

