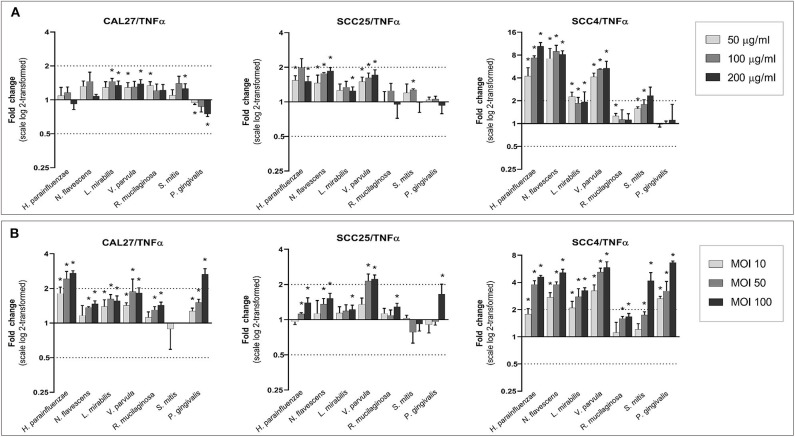
Figure 7.
Effect of the test bacteria on expression of TNFα. CAL27, SCC25, and SCC4 were either (A) exposed to 50, 100, and 200 μg/ml of each of the bacterial lysates, or (B) cocultured with each bacterium at MOIs of 10, 50, and 100. RNA was extracted after 24 h and TNFα was quantified using one-step q-RT-PCR, using CASC3 as reference gene. *Statistically significant compared to the non-treated control. Dashed line above and below horizontal axis indicate a 2-fold change.

