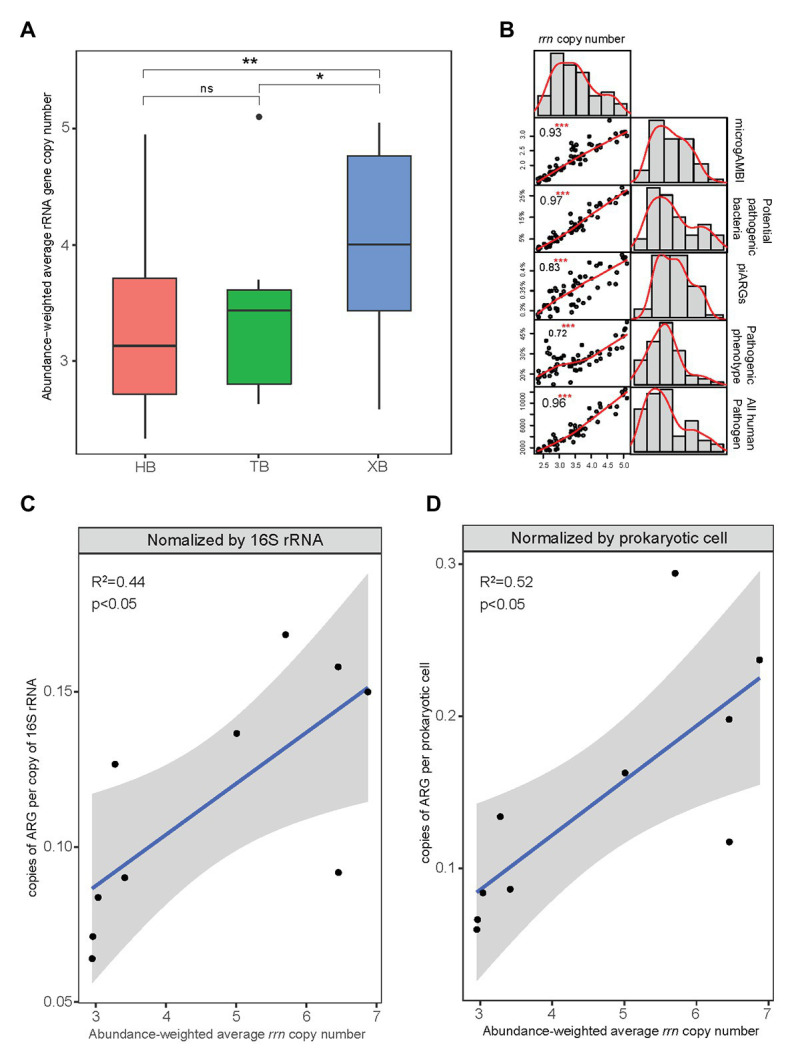
Figure 7.

Abundance-weighted average rRNA gene copy number of microbial communities in the three bays (*p < 0.05, **p < 0.01, ns means insignificant difference; A) and their correlation with other microbial indicators of tolerance and virulence (***p < 0.001; B). The relationship between abundance-weighted average ribosomal RNA operon (rrn) copy number and copies of ARGs (metagenomics data) according to previous studies (C,D).
