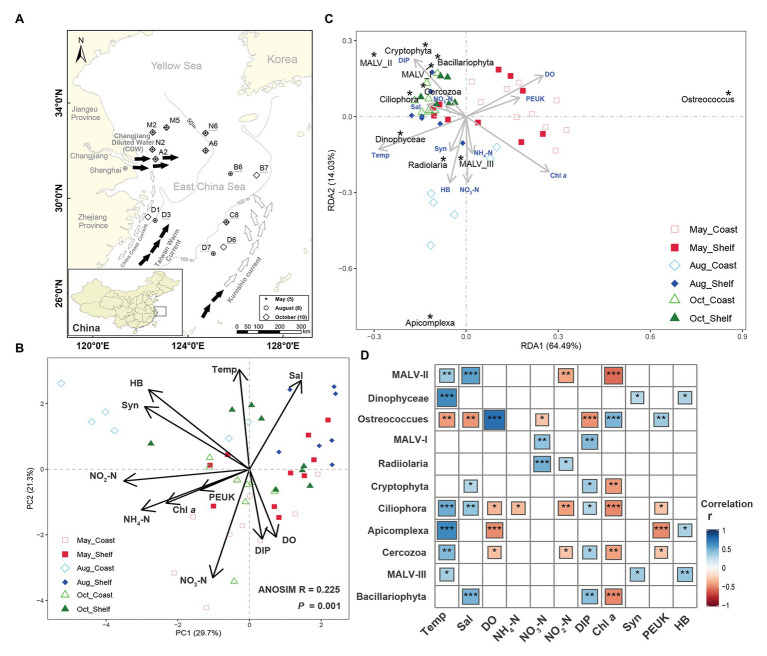
Figure 1.
Study area, spatiotemporal variation in environmental conditions, and the relationship with protist dominant lineages across three seasonally representative months and two habitats. (A) Location of the 13 sampling stations in the studied area in 3 months in 2013. Water samples in each station were simultaneously collected from both surface and bottom layers. Symbols indicate sampling months. Sample labels with underline indicate stations in shelf area (deeper than 50 m), whereas others represent stations in coastal area (lower than 50 m). The summer currents are indicated with black arrows, whereas white arrows represent spring and autumn currents. (B) Ordination biplots of the principal component analysis (PCA) of all environmental variables. (C) Redundancy analysis based on 37 lineages of protist and the environmental variables. Only 11 dominant taxa (percentage of reads >1% in all 60 samples) were marked in the figure. (D) Correlation analyses among the environmental factors and the relative abundance of the 11 dominant lineages (percentage of reads >1% in all 60 samples). Asterisks inside the squares indicate significant correlations (***p < 0.001; **p < 0.01; and *p < 0.05). Environmental codes are as follows: Temp, temperature (°C); Sal, salinity (psu); DO, dissolved oxygen (mg/L); NH4-N, ammonia nitrogen (μmol/L); NO3-N, nitrate (μmol/L); NO2-N, nitrite (μmol/L); DIP, dissolved inorganic phosphorus (μmol/L); Chl a, chlorophyll a (μg/ml); Syn, Synechococcus (cells/ml); PEUK, pico-eukaryotes (cells/ml); HB, heterotrophic bacteria (cells/ml).

