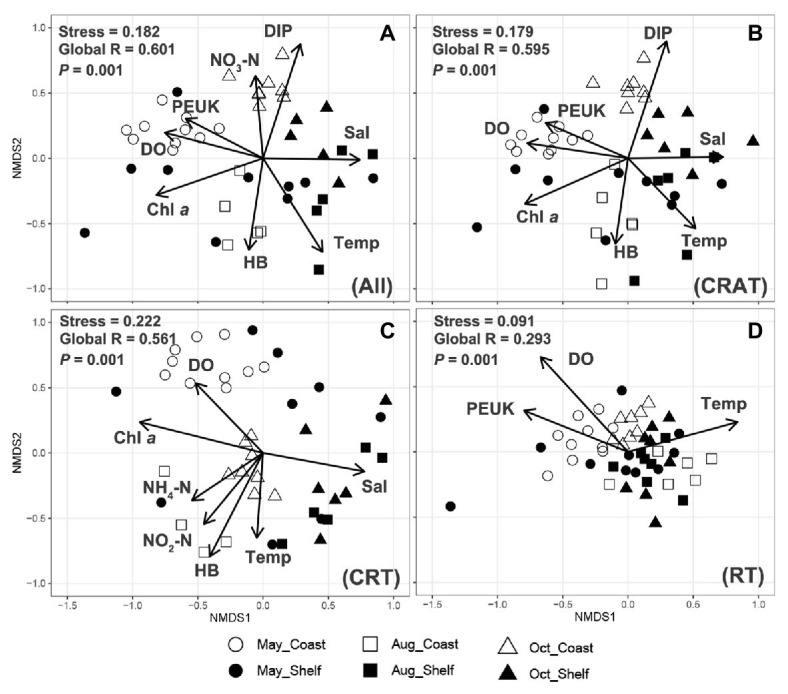
Figure 4.

Non-metric multidimensional scaling analysis showing the biogeographic distributing patterns of protist communities in the studied area and the significant environmental factors (p < 0.01) that influence the communities. The same clustering of samples into six groups across three seasonally representative months and two habitats is shared by the entire community (A. All) and three sub-communities (B. CRAT, C. CRT, and D. RT), based on Bray-Curtis dissimilarity between samples.
