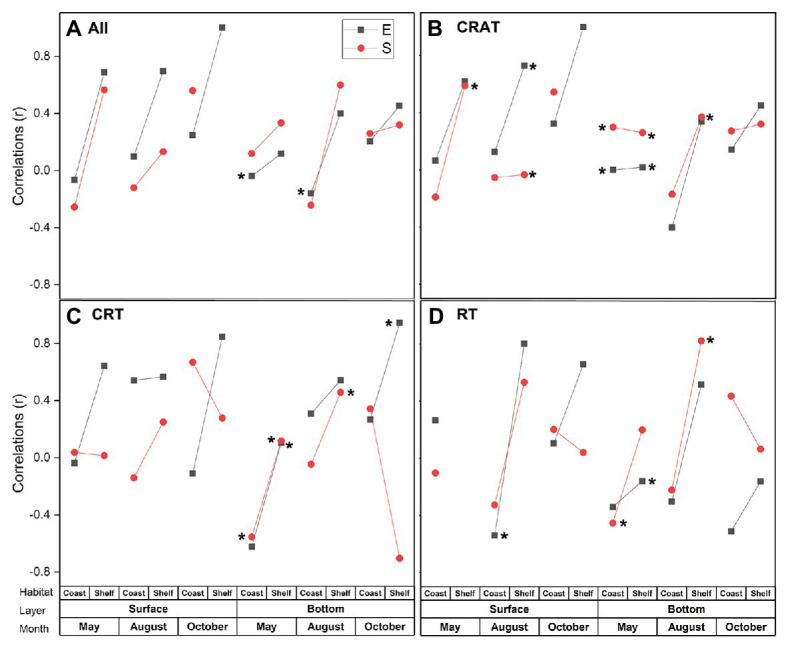
Figure 6.

Mantel tests for the correlations among environmental distance (E), spatial distance (S), and protist communities’ distance (A. All; B. CRAT; C. CRT; and D. RT) in surface and bottom layers in coastal and shelf areas in each season using Spearman’s rank coefficients. Asterisks besides the dot indicate significant correlations (p < 0.1).
